Travelers 2011 Annual Report Download - page 148
Download and view the complete annual report
Please find page 148 of the 2011 Travelers annual report below. You can navigate through the pages in the report by either clicking on the pages listed below, or by using the keyword search tool below to find specific information within the annual report.-
 1
1 -
 2
2 -
 3
3 -
 4
4 -
 5
5 -
 6
6 -
 7
7 -
 8
8 -
 9
9 -
 10
10 -
 11
11 -
 12
12 -
 13
13 -
 14
14 -
 15
15 -
 16
16 -
 17
17 -
 18
18 -
 19
19 -
 20
20 -
 21
21 -
 22
22 -
 23
23 -
 24
24 -
 25
25 -
 26
26 -
 27
27 -
 28
28 -
 29
29 -
 30
30 -
 31
31 -
 32
32 -
 33
33 -
 34
34 -
 35
35 -
 36
36 -
 37
37 -
 38
38 -
 39
39 -
 40
40 -
 41
41 -
 42
42 -
 43
43 -
 44
44 -
 45
45 -
 46
46 -
 47
47 -
 48
48 -
 49
49 -
 50
50 -
 51
51 -
 52
52 -
 53
53 -
 54
54 -
 55
55 -
 56
56 -
 57
57 -
 58
58 -
 59
59 -
 60
60 -
 61
61 -
 62
62 -
 63
63 -
 64
64 -
 65
65 -
 66
66 -
 67
67 -
 68
68 -
 69
69 -
 70
70 -
 71
71 -
 72
72 -
 73
73 -
 74
74 -
 75
75 -
 76
76 -
 77
77 -
 78
78 -
 79
79 -
 80
80 -
 81
81 -
 82
82 -
 83
83 -
 84
84 -
 85
85 -
 86
86 -
 87
87 -
 88
88 -
 89
89 -
 90
90 -
 91
91 -
 92
92 -
 93
93 -
 94
94 -
 95
95 -
 96
96 -
 97
97 -
 98
98 -
 99
99 -
 100
100 -
 101
101 -
 102
102 -
 103
103 -
 104
104 -
 105
105 -
 106
106 -
 107
107 -
 108
108 -
 109
109 -
 110
110 -
 111
111 -
 112
112 -
 113
113 -
 114
114 -
 115
115 -
 116
116 -
 117
117 -
 118
118 -
 119
119 -
 120
120 -
 121
121 -
 122
122 -
 123
123 -
 124
124 -
 125
125 -
 126
126 -
 127
127 -
 128
128 -
 129
129 -
 130
130 -
 131
131 -
 132
132 -
 133
133 -
 134
134 -
 135
135 -
 136
136 -
 137
137 -
 138
138 -
 139
139 -
 140
140 -
 141
141 -
 142
142 -
 143
143 -
 144
144 -
 145
145 -
 146
146 -
 147
147 -
 148
148 -
 149
149 -
 150
150 -
 151
151 -
 152
152 -
 153
153 -
 154
154 -
 155
155 -
 156
156 -
 157
157 -
 158
158 -
 159
159 -
 160
160 -
 161
161 -
 162
162 -
 163
163 -
 164
164 -
 165
165 -
 166
166 -
 167
167 -
 168
168 -
 169
169 -
 170
170 -
 171
171 -
 172
172 -
 173
173 -
 174
174 -
 175
175 -
 176
176 -
 177
177 -
 178
178 -
 179
179 -
 180
180 -
 181
181 -
 182
182 -
 183
183 -
 184
184 -
 185
185 -
 186
186 -
 187
187 -
 188
188 -
 189
189 -
 190
190 -
 191
191 -
 192
192 -
 193
193 -
 194
194 -
 195
195 -
 196
196 -
 197
197 -
 198
198 -
 199
199 -
 200
200 -
 201
201 -
 202
202 -
 203
203 -
 204
204 -
 205
205 -
 206
206 -
 207
207 -
 208
208 -
 209
209 -
 210
210 -
 211
211 -
 212
212 -
 213
213 -
 214
214 -
 215
215 -
 216
216 -
 217
217 -
 218
218 -
 219
219 -
 220
220 -
 221
221 -
 222
222 -
 223
223 -
 224
224 -
 225
225 -
 226
226 -
 227
227 -
 228
228 -
 229
229 -
 230
230 -
 231
231 -
 232
232 -
 233
233 -
 234
234 -
 235
235 -
 236
236 -
 237
237 -
 238
238 -
 239
239 -
 240
240 -
 241
241 -
 242
242 -
 243
243 -
 244
244 -
 245
245 -
 246
246 -
 247
247 -
 248
248 -
 249
249 -
 250
250 -
 251
251 -
 252
252 -
 253
253 -
 254
254 -
 255
255 -
 256
256 -
 257
257 -
 258
258 -
 259
259 -
 260
260 -
 261
261 -
 262
262 -
 263
263 -
 264
264 -
 265
265 -
 266
266 -
 267
267 -
 268
268 -
 269
269 -
 270
270 -
 271
271 -
 272
272 -
 273
273 -
 274
274 -
 275
275 -
 276
276 -
 277
277 -
 278
278 -
 279
279 -
 280
280 -
 281
281 -
 282
282 -
 283
283 -
 284
284 -
 285
285 -
 286
286 -
 287
287 -
 288
288 -
 289
289 -
 290
290 -
 291
291 -
 292
292 -
 293
293
 |
 |

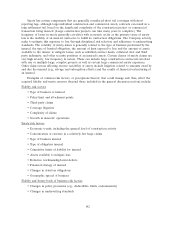
• Changes in the propensity to litigate rather than settle a claim
• Changes in statutes of limitations
• Changes in the underlying court system
• Distortions from losses resulting from large single accounts or single issues
• Changes in tort law
• Shifts in law suit mix between federal and state courts
• Changes in claim adjuster office structure (causing distortions in the data)
• Changes in settlement patterns (e.g., medical malpractice)
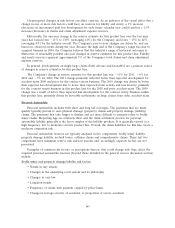
General liability book of business risk factors
• Changes in policy provisions (e.g., deductibles, policy limits, endorsements)
• Changes in underwriting standards
• Product mix (e.g., size of account, industries insured, jurisdiction mix)
Unanticipated changes in risk factors can affect reserves. As an indicator of the causal effect that a
change in one or more risk factors could have on reserves for general liability (excluding asbestos and
environmental), a 1% increase (decrease) in incremental paid loss development for each future
calendar year could result in a 1.5% increase (decrease) in claims and claim adjustment expense
reserves.
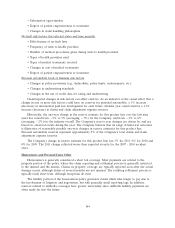
Historically, the one-year change in the reserve estimate for this product line, excluding estimated
asbestos and environmental amounts, over the last nine years has varied from 8% to 14% (averaging
1%) for the Company and from 5% to 7% (averaging 0%) for the industry overall. The Company’s
year-to-year changes are driven by, and are based on, observed events during the year. Because the
high end of the Company’s range of historical adverse development comes from certain businesses that
the Company has since exited, the Company believes that the industry’s range of historical outcomes is
illustrative of reasonably possible one-year changes in reserve estimates for this product line. General
liability reserves (excluding asbestos and environmental) represent approximately 25% of the
Company’s total claims and claim adjustment expense reserves.
The Company’s change in reserve estimate for this product line, excluding estimated asbestos and
environmental amounts, was 8% for 2011, 5% for 2010 and 5% for 2009. The 2011 change was
concentrated in excess coverages for accident years 2005-2008 and reflected what the Company believes
are more favorable legal and judicial environments than what the Company previously expected. The
2010 change was primarily concentrated in excess coverages for accident years 2006 and prior and
reflected what the Company believes are more favorable legal and judicial environments than what the
Company previously expected. The 2009 change was driven by several factors, including improved legal
and judicial environments, as well as enhanced risk control, underwriting and claim process initiatives.
Property
Property is generally considered a short tail line with a simpler and faster claim reporting and
adjustment process than liability coverages, and less uncertainty in the reserve setting process (except
for more complex business interruption claims). It is generally viewed as a moderate frequency, low to
moderate severity line, except for catastrophes and coverage related to large properties. The claim
reporting and settlement process for property coverage claim reserves is generally restricted to the
insured and the insurer. Overall, the claim liabilities for this line create a low estimation risk, except
possibly for catastrophes and business interruption claims.
136
