Travelers 2011 Annual Report Download - page 89
Download and view the complete annual report
Please find page 89 of the 2011 Travelers annual report below. You can navigate through the pages in the report by either clicking on the pages listed below, or by using the keyword search tool below to find specific information within the annual report.-
 1
1 -
2
-
3
-
4
-
5
-
6
-
7
-
8
-
9
-
10
-
11
-
12
-
13
-
14
-
15
-
16
-
17
-
18
-
19
-
20
-
21
-
22
-
23
-
24
-
25
-
26
-
27
-
28
-
29
-
30
-
31
-
32
-
33
-
34
-
35
-
36
-
37
-
38
-
39
-
40
-
41
-
42
-
43
-
44
-
45
-
46
-
47
-
48
-
49
-
50
-
51
-
52
-
53
-
54
-
55
-
56
-
57
-
58
-
59
-
60
-
61
-
62
-
63
-
64
-
65
-
66
-
67
-
68
-
69
-
70
-
71
-
72
-
73
-
74
-
75
-
76
-
77
-
78
-
 79
79 -
 80
80 -
 81
81 -
 82
82 -
 83
83 -
 84
84 -
 85
85 -
 86
86 -
 87
87 -
 88
88 -
 89
89 -
 90
90 -
 91
91 -
 92
92 -
 93
93 -
 94
94 -
 95
95 -
 96
96 -
 97
97 -
 98
98 -
 99
99 -
100
-
101
-
102
-
103
-
104
-
105
-
106
-
107
-
108
-
109
-
110
-
111
-
112
-
113
-
114
-
115
-
116
-
117
-
118
-
119
-
120
-
121
-
122
-
123
-
124
-
125
-
126
-
127
-
128
-
129
-
130
-
131
-
132
-
133
-
134
-
135
-
136
-
137
-
138
-
139
-
140
-
141
-
142
-
143
-
144
-
145
-
146
-
147
-
148
-
149
-
150
-
151
-
152
-
153
-
154
-
155
-
156
-
157
-
158
-
159
-
160
-
161
-
162
-
163
-
164
-
165
-
166
-
167
-
168
-
169
-
170
-
171
-
172
-
173
-
174
-
175
-
176
-
177
-
178
-
179
-
180
-
181
-
182
-
183
-
184
-
185
-
186
-
187
-
188
-
189
-
190
-
191
-
192
-
193
-
194
-
195
-
196
-
197
-
198
-
199
-
200
-
201
-
202
-
203
-
204
-
205
-
206
-
207
-
208
-
209
-
210
-
211
-
212
-
213
-
214
-
215
-
216
-
217
-
218
-
219
-
220
-
221
-
222
-
223
-
224
-
225
-
226
-
227
-
228
-
229
-
230
-
231
-
232
-
233
-
234
-
235
-
236
-
237
-
238
-
239
-
240
-
241
-
242
-
243
-
244
-
245
-
246
-
247
-
248
-
249
-
250
-
251
-
252
-
253
-
254
-
255
-
256
-
257
-
258
-
259
-
260
-
261
-
262
-
263
-
264
-
265
-
266
-
267
-
268
-
269
-
270
-
271
-
272
-
273
-
274
-
275
-
276
-
277
-
278
-
279
-
280
-
281
-
282
-
283
-
284
-
285
-
286
-
287
-
288
-
289
-
290
-
291
-
292
-
293
 |
 |

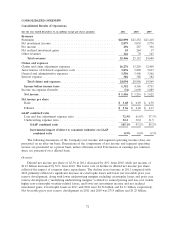
The consolidated loss and loss adjustment expense ratio of 72.9% in 2011 was 11.9 points higher
than the loss and loss adjustment expense ratio of 61.0% in 2010. Catastrophe losses accounted for 11.6
points and 5.2 points of the 2011 and 2010 loss and loss adjustment expense ratios, respectively. Net
favorable prior year reserve development provided 3.2 points and 5.8 points of benefit to the
consolidated loss and loss adjustment expense ratio in 2011 and 2010, respectively. The consolidated
loss and loss adjustment expense ratio excluding catastrophe losses and prior year reserve development
in 2011 was 2.9 points higher than the 2010 ratio on the same basis, primarily reflecting the impact of
loss cost trends and higher non-catastrophe weather-related losses.
The consolidated underwriting expense ratio of 32.2% in 2011 was level with the underwriting
expense ratio in 2010.
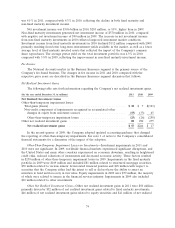
The consolidated GAAP combined ratio of 93.2% in 2010 was 4.0 points higher than the
consolidated GAAP combined ratio of 89.2% in 2009.
The consolidated loss and loss adjustment expense ratio of 61.0% in 2010 was 3.7 points higher
than the loss and loss adjustment expense ratio of 57.3% in 2009. Catastrophe losses accounted for 5.2
points and 2.1 points of the 2010 and 2009 loss and loss adjustment expense ratios, respectively. Net
favorable prior year reserve development provided 5.8 points and 6.2 points of benefit to the
consolidated loss and loss adjustment expense ratio in 2010 and 2009, respectively. The consolidated
loss and loss adjustment expense ratio excluding catastrophe losses and prior year reserve development
in 2010 was 0.2 points higher than the 2009 ratio on the same basis, primarily reflecting the impact of
loss cost trends.
The consolidated underwriting expense ratio of 32.2% in 2010 was 0.3 points higher than the 2009
consolidated underwriting expense ratio of 31.9%. The 2009 ratio reflected a 0.4 point benefit resulting
from the reduction in the estimate of property windpool assessments related to Hurricane Ike.
Excluding that factor in 2009, the consolidated underwriting expense ratio in 2010 was 0.1 points lower
than in 2009.
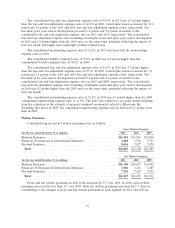
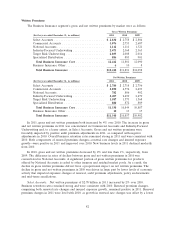
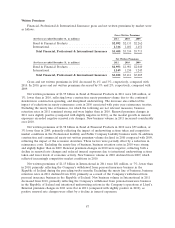
Written Premiums
Consolidated gross and net written premiums were as follows:
Gross Written Premiums
(for the year ended December 31, in millions) 2011 2010 2009
Business Insurance ........................................ $12,418 $11,891 $12,098
Financial, Professional & International Insurance .................. 3,408 3,534 3,713
Personal Insurance ........................................ 8,061 7,877 7,474
Total ................................................ $23,887 $23,302 $23,285
Net Written Premiums
(for the year ended December 31, in millions) 2011 2010 2009
Business Insurance ........................................ $11,340 $10,857 $10,902
Financial, Professional & International Insurance .................. 3,102 3,211 3,285
Personal Insurance ........................................ 7,745 7,567 7,149
Total ................................................ $22,187 $21,635 $21,336
Gross and net written premiums in 2011 both increased by 3% over 2010. In 2010, gross written
premiums increased by less than 1% over 2009, while net written premiums increased by 1%. Factors
contributing to the changes in gross and net written premiums in each segment in 2011 and 2010 as
77