Travelers 2011 Annual Report Download - page 86
Download and view the complete annual report
Please find page 86 of the 2011 Travelers annual report below. You can navigate through the pages in the report by either clicking on the pages listed below, or by using the keyword search tool below to find specific information within the annual report.-
 1
1 -
2
-
3
-
4
-
5
-
6
-
7
-
8
-
9
-
10
-
11
-
12
-
13
-
14
-
15
-
16
-
17
-
18
-
19
-
20
-
21
-
22
-
23
-
24
-
25
-
26
-
27
-
28
-
29
-
30
-
31
-
32
-
33
-
34
-
35
-
36
-
37
-
38
-
39
-
40
-
41
-
42
-
43
-
44
-
45
-
46
-
47
-
48
-
49
-
50
-
51
-
52
-
53
-
54
-
55
-
56
-
57
-
58
-
59
-
60
-
61
-
62
-
63
-
64
-
65
-
66
-
67
-
68
-
69
-
70
-
71
-
72
-
73
-
74
-
75
-
 76
76 -
 77
77 -
 78
78 -
 79
79 -
 80
80 -
 81
81 -
 82
82 -
 83
83 -
 84
84 -
 85
85 -
 86
86 -
 87
87 -
 88
88 -
 89
89 -
 90
90 -
 91
91 -
 92
92 -
 93
93 -
 94
94 -
 95
95 -
 96
96 -
97
-
98
-
99
-
100
-
101
-
102
-
103
-
104
-
105
-
106
-
107
-
108
-
109
-
110
-
111
-
112
-
113
-
114
-
115
-
116
-
117
-
118
-
119
-
120
-
121
-
122
-
123
-
124
-
125
-
126
-
127
-
128
-
129
-
130
-
131
-
132
-
133
-
134
-
135
-
136
-
137
-
138
-
139
-
140
-
141
-
142
-
143
-
144
-
145
-
146
-
147
-
148
-
149
-
150
-
151
-
152
-
153
-
154
-
155
-
156
-
157
-
158
-
159
-
160
-
161
-
162
-
163
-
164
-
165
-
166
-
167
-
168
-
169
-
170
-
171
-
172
-
173
-
174
-
175
-
176
-
177
-
178
-
179
-
180
-
181
-
182
-
183
-
184
-
185
-
186
-
187
-
188
-
189
-
190
-
191
-
192
-
193
-
194
-
195
-
196
-
197
-
198
-
199
-
200
-
201
-
202
-
203
-
204
-
205
-
206
-
207
-
208
-
209
-
210
-
211
-
212
-
213
-
214
-
215
-
216
-
217
-
218
-
219
-
220
-
221
-
222
-
223
-
224
-
225
-
226
-
227
-
228
-
229
-
230
-
231
-
232
-
233
-
234
-
235
-
236
-
237
-
238
-
239
-
240
-
241
-
242
-
243
-
244
-
245
-
246
-
247
-
248
-
249
-
250
-
251
-
252
-
253
-
254
-
255
-
256
-
257
-
258
-
259
-
260
-
261
-
262
-
263
-
264
-
265
-
266
-
267
-
268
-
269
-
270
-
271
-
272
-
273
-
274
-
275
-
276
-
277
-
278
-
279
-
280
-
281
-
282
-
283
-
284
-
285
-
286
-
287
-
288
-
289
-
290
-
291
-
292
-
293
 |
 |

was 4.1% in 2011, compared with 4.3% in 2010, reflecting the decline in both fixed maturity and
non-fixed maturity investment income.
Net investment income was $3.06 billion in 2010, $283 million, or 10%, higher than in 2009.
Non-fixed maturity investments generated net investment income of $370 million in 2010, compared
with negative net investment income of $40 million in 2009. The increase in net investment income
from non-fixed maturity investments in 2010 reflected improved investment market conditions.
Investment income from fixed maturity investments in 2010 declined $112 million compared with 2009,
primarily resulting from lower long-term reinvestment yields available in the market, as well as a lower
average level of fixed maturity invested assets that reflected the impact of the Company’s common
share repurchases. The average pretax yield on the total investment portfolio was 4.3% in 2010,
compared with 3.8% in 2009, reflecting the improvement in non-fixed maturity investment income.
Fee Income
The National Accounts market in the Business Insurance segment is the primary source of the
Company’s fee-based business. The changes in fee income in 2011 and 2010 compared with the
respective prior years are described in the Business Insurance segment discussion that follows.
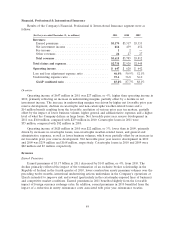
Net Realized Investment Gains
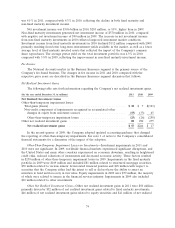
The following table sets forth information regarding the Company’s net realized investment gains.
(for the year ended December 31, in millions) 2011 2010 2009
Net Realized Investment Gains
Other-than-temporary impairment losses:
Total gains (losses) ............................................ $30 $ 7 $(323)
Non-credit component of impairments recognized in accumulated other
changes in equity from nonowner sources .......................... (55) (33) 65
Other-than-temporary impairment losses .......................... (25) (26) (258)
Other net realized investment gains ................................. 80 290 275
Net realized investment gains .................................. $55 $264 $ 17
In the second quarter of 2009, the Company adopted updated accounting guidance that changed
the reporting of other-than-temporary impairments. See note 1 of notes to the Company’s consolidated
financial statements for a discussion of the impact of the adoption.
Other-Than-Temporary Impairment Losses on Investments—Investment impairments in 2011 and
2010 were not significant. In 2009, worldwide financial markets experienced significant disruptions, and
the United States and many other countries experienced an economic downturn, resulting in heightened
credit risks, reduced valuations of investments and decreased economic activity. These factors resulted
in $258 million of other-than-temporary impairment losses in 2009. Impairments in the fixed maturity
portfolio in 2009 were $169 million and included $81 million related to structured mortgage securities,
$70 million related to various issuers’ deteriorated financial position and $18 million with respect to
securities that the Company either had the intent to sell or did not have the ability to assert an
intention to hold until recovery in fair value. Equity impairments in 2009 were $79 million, the majority
of which were related to issuers in the financial services industry. Impairments in 2009 also included
$10 million related to other investments.
Other Net Realized Investment Gains—Other net realized investment gains in 2011 were $80 million,
primarily driven by $52 million of net realized investment gains related to fixed maturity investments,
$46 million of net realized investment gains related to equity securities and $41 million of net realized
74