Travelers 2011 Annual Report Download - page 106
Download and view the complete annual report
Please find page 106 of the 2011 Travelers annual report below. You can navigate through the pages in the report by either clicking on the pages listed below, or by using the keyword search tool below to find specific information within the annual report.-
 1
1 -
2
-
3
-
4
-
5
-
6
-
7
-
8
-
9
-
10
-
11
-
12
-
13
-
14
-
15
-
16
-
17
-
18
-
19
-
20
-
21
-
22
-
23
-
24
-
25
-
26
-
27
-
28
-
29
-
30
-
31
-
32
-
33
-
34
-
35
-
36
-
37
-
38
-
39
-
40
-
41
-
42
-
43
-
44
-
45
-
46
-
47
-
48
-
49
-
50
-
51
-
52
-
53
-
54
-
55
-
56
-
57
-
58
-
59
-
60
-
61
-
62
-
63
-
64
-
65
-
66
-
67
-
68
-
69
-
70
-
71
-
72
-
73
-
74
-
75
-
76
-
77
-
78
-
79
-
80
-
81
-
82
-
83
-
84
-
85
-
86
-
87
-
88
-
89
-
90
-
91
-
92
-
93
-
94
-
95
-
 96
96 -
 97
97 -
 98
98 -
 99
99 -
 100
100 -
 101
101 -
 102
102 -
 103
103 -
 104
104 -
 105
105 -
 106
106 -
 107
107 -
 108
108 -
 109
109 -
 110
110 -
 111
111 -
 112
112 -
 113
113 -
 114
114 -
 115
115 -
 116
116 -
117
-
118
-
119
-
120
-
121
-
122
-
123
-
124
-
125
-
126
-
127
-
128
-
129
-
130
-
131
-
132
-
133
-
134
-
135
-
136
-
137
-
138
-
139
-
140
-
141
-
142
-
143
-
144
-
145
-
146
-
147
-
148
-
149
-
150
-
151
-
152
-
153
-
154
-
155
-
156
-
157
-
158
-
159
-
160
-
161
-
162
-
163
-
164
-
165
-
166
-
167
-
168
-
169
-
170
-
171
-
172
-
173
-
174
-
175
-
176
-
177
-
178
-
179
-
180
-
181
-
182
-
183
-
184
-
185
-
186
-
187
-
188
-
189
-
190
-
191
-
192
-
193
-
194
-
195
-
196
-
197
-
198
-
199
-
200
-
201
-
202
-
203
-
204
-
205
-
206
-
207
-
208
-
209
-
210
-
211
-
212
-
213
-
214
-
215
-
216
-
217
-
218
-
219
-
220
-
221
-
222
-
223
-
224
-
225
-
226
-
227
-
228
-
229
-
230
-
231
-
232
-
233
-
234
-
235
-
236
-
237
-
238
-
239
-
240
-
241
-
242
-
243
-
244
-
245
-
246
-
247
-
248
-
249
-
250
-
251
-
252
-
253
-
254
-
255
-
256
-
257
-
258
-
259
-
260
-
261
-
262
-
263
-
264
-
265
-
266
-
267
-
268
-
269
-
270
-
271
-
272
-
273
-
274
-
275
-
276
-
277
-
278
-
279
-
280
-
281
-
282
-
283
-
284
-
285
-
286
-
287
-
288
-
289
-
290
-
291
-
292
-
293
 |
 |

• a further decrease in the number of large asbestos exposures confronting the Company due to
additional settlement activity;
• continued moderate level of asbestos-related bankruptcy activity; and
• the absence of new theories of liability or new classes of defendants.
While the Company believes that over the past several years there has been a reduction in the
volatility associated with the Company’s overall asbestos exposure, there nonetheless remains a high
degree of uncertainty with respect to future exposure from asbestos claims.
As in prior years, the annual claim review considered active policyholders and litigation cases for
potential product and ‘‘non-product’’ liability. While the Home Office and Field Office categories,
which account for the vast majority of policyholders with active asbestos-related claims, experienced a
slight reduction in the number of policyholders with open asbestos claims compared with the prior year
period, gross asbestos-related payments in these categories increased slightly in 2011 compared with
2010. Payments on behalf of policyholders in these categories continue to be influenced by the high
level of litigation activity in a limited number of jurisdictions where individuals alleging serious
asbestos-related injury continue to target previously peripheral defendants.
The completion of these reviews and analyses in 2011 and 2010 resulted in $175 million and
$140 million increases, respectively, in the Company’s net asbestos reserves, primarily driven by
increases in the Company’s estimate of projected settlement and defense costs related to a broad
number of policyholders and higher projected payments on assumed reinsurance accounts. The increase
in the estimate of projected settlement and defense costs resulted from recent payment trends being
moderately higher than previously anticipated due to the impact of the current litigation environment
discussed above. Notwithstanding these trends, the Company’s overall view of the underlying asbestos
environment is essentially unchanged from recent periods. The increase in 2010 also reflected increases
in costs of litigating asbestos-related coverage matters and was partially offset by a $70 million benefit
from the reduction in the allowance for uncollectible reinsurance resulting from a favorable ruling
related to a reinsurance dispute. In 2009, the Company recorded a $185 million increase in asbestos
reserves, primarily driven by a slight increase in the Company’s assumption for projected defense costs
related to many policyholders.
Net asbestos losses paid in 2011, 2010 and 2009 were $284 million, $350 million and $341 million,
respectively. The decrease in gross and net paid losses in 2011 primarily resulted from completing,
during 2010, the final installment payments on a previously reserved settlement. Approximately 19%,
32% and 41% of total net paid losses in 2011, 2010 and 2009, respectively, related to policyholders with
whom the Company had entered into settlement agreements limiting the Company’s liability.
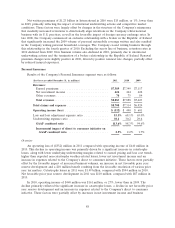
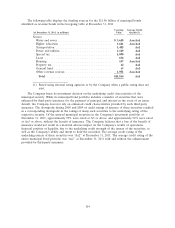
The Company categorizes its asbestos reserves as follows:
Number of Net Asbestos
Policyholders Total Net Paid Reserves
(at and for the year ended December 31, $ in millions) 2011 2010 2011 2010 2011 2010
Policyholders with settlement agreements .......... 15 17 $54 $112 $ 588 $ 583
Home office and field office .................... 1,616 1,705 199 209 1,660 1,778
Assumed reinsurance and other ................. ——31 29 191 187
Total ................................... 1,631 1,722 $284 $350 $2,439 $2,548
The ‘‘policyholders with settlement agreements’’ category includes structured settlements, coverage
in place arrangements and, with respect to TPC, Wellington accounts. Reserves are based on the
expected payout for each policyholder under the applicable agreement. Structured settlements are
arrangements under which policyholders and/or plaintiffs agree to fixed financial amounts to be paid at
94