Travelers 2011 Annual Report Download - page 120
Download and view the complete annual report
Please find page 120 of the 2011 Travelers annual report below. You can navigate through the pages in the report by either clicking on the pages listed below, or by using the keyword search tool below to find specific information within the annual report.-
 1
1 -
2
-
3
-
4
-
5
-
6
-
7
-
8
-
9
-
10
-
11
-
12
-
13
-
14
-
15
-
16
-
17
-
18
-
19
-
20
-
21
-
22
-
23
-
24
-
25
-
26
-
27
-
28
-
29
-
30
-
31
-
32
-
33
-
34
-
35
-
36
-
37
-
38
-
39
-
40
-
41
-
42
-
43
-
44
-
45
-
46
-
47
-
48
-
49
-
50
-
51
-
52
-
53
-
54
-
55
-
56
-
57
-
58
-
59
-
60
-
61
-
62
-
63
-
64
-
65
-
66
-
67
-
68
-
69
-
70
-
71
-
72
-
73
-
74
-
75
-
76
-
77
-
78
-
79
-
80
-
81
-
82
-
83
-
84
-
85
-
86
-
87
-
88
-
89
-
90
-
91
-
92
-
93
-
94
-
95
-
96
-
97
-
98
-
99
-
100
-
101
-
102
-
103
-
104
-
105
-
106
-
107
-
108
-
109
-
 110
110 -
 111
111 -
 112
112 -
 113
113 -
 114
114 -
 115
115 -
 116
116 -
 117
117 -
 118
118 -
 119
119 -
 120
120 -
 121
121 -
 122
122 -
 123
123 -
 124
124 -
 125
125 -
 126
126 -
 127
127 -
 128
128 -
 129
129 -
 130
130 -
131
-
132
-
133
-
134
-
135
-
136
-
137
-
138
-
139
-
140
-
141
-
142
-
143
-
144
-
145
-
146
-
147
-
148
-
149
-
150
-
151
-
152
-
153
-
154
-
155
-
156
-
157
-
158
-
159
-
160
-
161
-
162
-
163
-
164
-
165
-
166
-
167
-
168
-
169
-
170
-
171
-
172
-
173
-
174
-
175
-
176
-
177
-
178
-
179
-
180
-
181
-
182
-
183
-
184
-
185
-
186
-
187
-
188
-
189
-
190
-
191
-
192
-
193
-
194
-
195
-
196
-
197
-
198
-
199
-
200
-
201
-
202
-
203
-
204
-
205
-
206
-
207
-
208
-
209
-
210
-
211
-
212
-
213
-
214
-
215
-
216
-
217
-
218
-
219
-
220
-
221
-
222
-
223
-
224
-
225
-
226
-
227
-
228
-
229
-
230
-
231
-
232
-
233
-
234
-
235
-
236
-
237
-
238
-
239
-
240
-
241
-
242
-
243
-
244
-
245
-
246
-
247
-
248
-
249
-
250
-
251
-
252
-
253
-
254
-
255
-
256
-
257
-
258
-
259
-
260
-
261
-
262
-
263
-
264
-
265
-
266
-
267
-
268
-
269
-
270
-
271
-
272
-
273
-
274
-
275
-
276
-
277
-
278
-
279
-
280
-
281
-
282
-
283
-
284
-
285
-
286
-
287
-
288
-
289
-
290
-
291
-
292
-
293
 |
 |

Equity Securities Available for Sale, Real Estate and Short-Term Securities
See note 1 of notes to the Company’s consolidated financial statements for further information
about these invested asset classes.
Other Investments
At December 31, 2011 and 2010, the carrying value of the Company’s other investments was
$3.45 billion and $2.93 billion, respectively. The Company’s other investments are primarily comprised
of private equity limited partnerships, hedge funds, real estate partnerships, joint ventures, mortgage
loans, venture capital (through direct ownership and limited partnerships) and trading securities, which
are subject to more volatility than the Company’s fixed maturity investments. These asset classes have
historically provided a higher return than fixed maturities but are subject to more volatility. Net
investment income provided by these asset classes was $292 million and $304 million in 2011 and 2010,
respectively, compared with negative net investment income of $106 million in 2009. The negative net
investment income in 2009 reflected market conditions.
Securities Lending
The Company has engaged in securities lending activities from which it generates net investment
income by lending certain of its investments to other institutions for short periods of time. The
Company has not incurred any investment losses in its securities lending program for the years ended
December 31, 2011, 2010 and 2009.
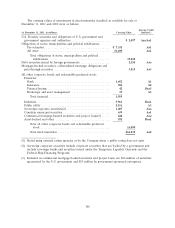
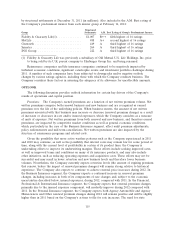
Net Unrealized Investment Gains
The net unrealized investment gains that were included as a separate component of accumulated
other changes in equity from nonowner sources were as follows:
(at December 31, in millions) 2011 2010 2009
Fixed maturities ............................... $4,238 $2,650 $2,536
Equity securities ............................... 145 147 78
Other investments ............................. 16 30 208
Unrealized investment gains before tax ............. 4,399 2,827 2,822
Tax expense .................................. 1,528 968 966
Net unrealized investment gains at end of year ....... $2,871 $1,859 $1,856
Net pretax unrealized investment gains were $4.40 billion, $2.83 billion and $2.82 billion at
December 31, 2011, 2010 and 2009, respectively. The Company’s fixed maturities portfolio at
December 31, 2011 experienced an increase in valuation compared with the prior year-end, primarily
due to the continuing decline in market interest rates. The Company’s fixed maturities and equity
securities portfolios at December 31, 2010 experienced increases in valuations compared with the prior
year-end, which were offset by a decrease in net unrealized appreciation on other investments that
primarily resulted from the Company’s sale of substantially all of its common stock holdings in Verisk
Analytics, Inc. That sale generated a pretax realized investment gain of $205 million in 2010.
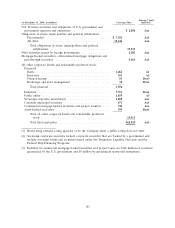
The following table summarizes, for all fixed maturities and equity securities reported at fair value
for which fair value is less than 80% of amortized cost at December 31, 2011, the gross unrealized
108