Travelers 2011 Annual Report Download - page 219
Download and view the complete annual report
Please find page 219 of the 2011 Travelers annual report below. You can navigate through the pages in the report by either clicking on the pages listed below, or by using the keyword search tool below to find specific information within the annual report.-
 1
1 -
2
-
3
-
4
-
5
-
6
-
7
-
8
-
9
-
10
-
11
-
12
-
13
-
14
-
15
-
16
-
17
-
18
-
19
-
20
-
21
-
22
-
23
-
24
-
25
-
26
-
27
-
28
-
29
-
30
-
31
-
32
-
33
-
34
-
35
-
36
-
37
-
38
-
39
-
40
-
41
-
42
-
43
-
44
-
45
-
46
-
47
-
48
-
49
-
50
-
51
-
52
-
53
-
54
-
55
-
56
-
57
-
58
-
59
-
60
-
61
-
62
-
63
-
64
-
65
-
66
-
67
-
68
-
69
-
70
-
71
-
72
-
73
-
74
-
75
-
76
-
77
-
78
-
79
-
80
-
81
-
82
-
83
-
84
-
85
-
86
-
87
-
88
-
89
-
90
-
91
-
92
-
93
-
94
-
95
-
96
-
97
-
98
-
99
-
100
-
101
-
102
-
103
-
104
-
105
-
106
-
107
-
108
-
109
-
110
-
111
-
112
-
113
-
114
-
115
-
116
-
117
-
118
-
119
-
120
-
121
-
122
-
123
-
124
-
125
-
126
-
127
-
128
-
129
-
130
-
131
-
132
-
133
-
134
-
135
-
136
-
137
-
138
-
139
-
140
-
141
-
142
-
143
-
144
-
145
-
146
-
147
-
148
-
149
-
150
-
151
-
152
-
153
-
154
-
155
-
156
-
157
-
158
-
159
-
160
-
161
-
162
-
163
-
164
-
165
-
166
-
167
-
168
-
169
-
170
-
171
-
172
-
173
-
174
-
175
-
176
-
177
-
178
-
179
-
180
-
181
-
182
-
183
-
184
-
185
-
186
-
187
-
188
-
189
-
190
-
191
-
192
-
193
-
194
-
195
-
196
-
197
-
198
-
199
-
200
-
201
-
202
-
203
-
204
-
205
-
206
-
207
-
208
-
 209
209 -
 210
210 -
 211
211 -
 212
212 -
 213
213 -
 214
214 -
 215
215 -
 216
216 -
 217
217 -
 218
218 -
 219
219 -
 220
220 -
 221
221 -
 222
222 -
 223
223 -
 224
224 -
 225
225 -
 226
226 -
 227
227 -
 228
228 -
 229
229 -
230
-
231
-
232
-
233
-
234
-
235
-
236
-
237
-
238
-
239
-
240
-
241
-
242
-
243
-
244
-
245
-
246
-
247
-
248
-
249
-
250
-
251
-
252
-
253
-
254
-
255
-
256
-
257
-
258
-
259
-
260
-
261
-
262
-
263
-
264
-
265
-
266
-
267
-
268
-
269
-
270
-
271
-
272
-
273
-
274
-
275
-
276
-
277
-
278
-
279
-
280
-
281
-
282
-
283
-
284
-
285
-
286
-
287
-
288
-
289
-
290
-
291
-
292
-
293
 |
 |
THE TRAVELERS COMPANIES, INC. AND SUBSIDIARIES
NOTES TO CONSOLIDATED FINANCIAL STATEMENTS (Continued)
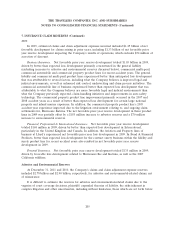
7. INSURANCE CLAIM RESERVES (Continued)
level of litigation activity in a limited number of jurisdictions where individuals alleging serious
asbestos-related injury continue to target previously peripheral defendants.
The completion of these reviews and analyses in 2011 and 2010 resulted in $175 million and
$140 million increases, respectively, in the Company’s net asbestos reserves, primarily driven by
increases in the Company’s estimate of projected settlement and defense costs related to a broad
number of policyholders and higher projected payments on assumed reinsurance accounts. The increase
in the estimate of projected settlement and defense costs resulted from recent payment trends being
moderately higher than previously anticipated due to the impact of the current litigation environment
discussed above. Notwithstanding these trends, the Company’s overall view of the underlying asbestos
environment is essentially unchanged from recent periods. The increase in 2010 also reflected increases
in costs of litigating asbestos-related coverage matters and was partially offset by a $70 million benefit
from the reduction in the allowance for uncollectible reinsurance resulting from a favorable ruling
related to a reinsurance dispute. In 2009, the Company recorded a $185 million increase in asbestos
reserves, primarily driven by a slight increase in the Company’s assumption for projected defense costs
related to many policyholders.
Net asbestos losses paid in 2011, 2010 and 2009 were $284 million, $350 million and $341 million,
respectively. Approximately 19%, 32% and 41% of total net paid losses in 2011, 2010 and 2009,
respectively, related to policyholders with whom the Company had entered into settlement agreements
limiting the Company’s liability.
Environmental Reserves. In establishing environmental reserves, the Company evaluates the
exposure presented by each policyholder and the anticipated cost of resolution, if any. In the course of
this analysis, the Company generally considers the probable liability, available coverage, relevant judicial
interpretations and historical value of similar exposures. In addition, the Company considers the many
variables presented, such as: the nature of the alleged activities of the policyholder at each site; the
number of sites; the total number of potentially responsible parties at each site; the nature of the
alleged environmental harm and the corresponding remedy at each site; the nature of government
enforcement activities at each site; the ownership and general use of each site; the overall nature of the
insurance relationship between the Company and the policyholder, including the role of any umbrella
or excess insurance the Company has issued to the policyholder; the involvement of other insurers; the
potential for other available coverage, including the number of years of coverage; the role, if any, of
non-environmental claims or potential non-environmental claims in any resolution process; and the
applicable law in each jurisdiction. The evaluation of the exposure presented by a policyholder can
change as information concerning that policyholder and the many variables presented is developed.
Conventional actuarial techniques are not used to estimate these reserves.
The Company continues to receive notices from policyholders tendering claims for the first time.
These policyholders continue to present smaller exposures, have fewer sites and are lower tier
defendants. Further, in many instances, clean-up costs have been reduced because regulatory agencies
are willing to accept risk-based site analyses and more efficient clean-up technologies. Over the past
several years, the Company has experienced generally favorable trends in overall environmental claim
payments, in the number of new policyholders tendering environmental claims for the first time and in
the number of pending declaratory judgment actions relating to environmental matters. However, in
2011, the Company increased its net environmental reserves by $76 million, primarily because the
degree to which those favorable trends continued was less than anticipated. In 2010, the Company
207