Travelers 2011 Annual Report Download - page 140
Download and view the complete annual report
Please find page 140 of the 2011 Travelers annual report below. You can navigate through the pages in the report by either clicking on the pages listed below, or by using the keyword search tool below to find specific information within the annual report.-
 1
1 -
2
-
3
-
4
-
5
-
6
-
7
-
8
-
9
-
10
-
11
-
12
-
13
-
14
-
15
-
16
-
17
-
18
-
19
-
20
-
21
-
22
-
23
-
24
-
25
-
26
-
27
-
28
-
29
-
30
-
31
-
32
-
33
-
34
-
35
-
36
-
37
-
38
-
39
-
40
-
41
-
42
-
43
-
44
-
45
-
46
-
47
-
48
-
49
-
50
-
51
-
52
-
53
-
54
-
55
-
56
-
57
-
58
-
59
-
60
-
61
-
62
-
63
-
64
-
65
-
66
-
67
-
68
-
69
-
70
-
71
-
72
-
73
-
74
-
75
-
76
-
77
-
78
-
79
-
80
-
81
-
82
-
83
-
84
-
85
-
86
-
87
-
88
-
89
-
90
-
91
-
92
-
93
-
94
-
95
-
96
-
97
-
98
-
99
-
100
-
101
-
102
-
103
-
104
-
105
-
106
-
107
-
108
-
109
-
110
-
111
-
112
-
113
-
114
-
115
-
116
-
117
-
118
-
119
-
120
-
121
-
122
-
123
-
124
-
125
-
126
-
127
-
128
-
129
-
 130
130 -
 131
131 -
 132
132 -
 133
133 -
 134
134 -
 135
135 -
 136
136 -
 137
137 -
 138
138 -
 139
139 -
 140
140 -
 141
141 -
 142
142 -
 143
143 -
 144
144 -
 145
145 -
 146
146 -
 147
147 -
 148
148 -
 149
149 -
 150
150 -
151
-
152
-
153
-
154
-
155
-
156
-
157
-
158
-
159
-
160
-
161
-
162
-
163
-
164
-
165
-
166
-
167
-
168
-
169
-
170
-
171
-
172
-
173
-
174
-
175
-
176
-
177
-
178
-
179
-
180
-
181
-
182
-
183
-
184
-
185
-
186
-
187
-
188
-
189
-
190
-
191
-
192
-
193
-
194
-
195
-
196
-
197
-
198
-
199
-
200
-
201
-
202
-
203
-
204
-
205
-
206
-
207
-
208
-
209
-
210
-
211
-
212
-
213
-
214
-
215
-
216
-
217
-
218
-
219
-
220
-
221
-
222
-
223
-
224
-
225
-
226
-
227
-
228
-
229
-
230
-
231
-
232
-
233
-
234
-
235
-
236
-
237
-
238
-
239
-
240
-
241
-
242
-
243
-
244
-
245
-
246
-
247
-
248
-
249
-
250
-
251
-
252
-
253
-
254
-
255
-
256
-
257
-
258
-
259
-
260
-
261
-
262
-
263
-
264
-
265
-
266
-
267
-
268
-
269
-
270
-
271
-
272
-
273
-
274
-
275
-
276
-
277
-
278
-
279
-
280
-
281
-
282
-
283
-
284
-
285
-
286
-
287
-
288
-
289
-
290
-
291
-
292
-
293
 |
 |

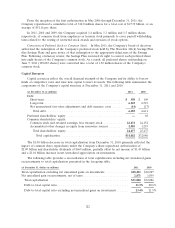
Off-Balance Sheet Arrangements
The Company has entered into certain contingent obligations for guarantees related to certain
investments, third-party loans related to certain investments, certain insurance policy obligations of
former insurance subsidiaries and various other indemnifications, including those related to the sale of
business entities. See note 15 of notes to the Company’s consolidated financial statements. The
Company does not expect these arrangements to have a material effect on the Company’s financial
position, changes in financial position, revenues and expenses, results of operations, liquidity, capital
expenditures or capital resources.
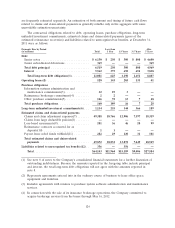
CRITICAL ACCOUNTING ESTIMATES
The Company considers its most significant accounting estimates to be those applied to claims and
claim adjustment expense reserves and related reinsurance recoverables, investment valuation and
impairments and goodwill and other intangible assets impairments.
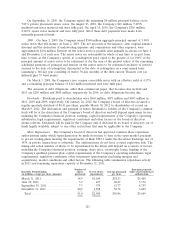
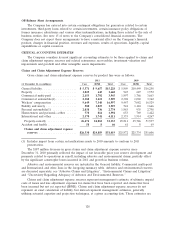
Claims and Claim Adjustment Expense Reserves
Gross claims and claim adjustment expense reserves by product line were as follows:
2011 2010
(at December 31, in millions) Case IBNR Total Case IBNR Total
General liability .................... $ 5,571 $ 9,657 $15,228 $ 5,809 $10,449 $16,258
Property ......................... 1,025 643 1,668 945 627 1,572
Commercial multi-peril .............. 2,153 1,792 3,945 1,897 1,766 3,663
Commercial automobile(1) ............ 2,388 1,121 3,509 2,302 1,060 3,362
Workers’ compensation .............. 9,649 7,348 16,997 9,447 7,082 16,529
Fidelity and surety .................. 500 1,029 1,529 542 1,124 1,666
Personal automobile(1) .............. 2,038 736 2,774 1,863 935 2,798
Homeowners and personal—other ...... 778 814 1,592 653 769 1,422
International and other .............. 2,370 1,741 4,111 2,353 1,914 4,267
Property-casualty ................. 26,472 24,881 51,353 25,811 25,726 51,537
Accident and health ................. 58 8 66 61 8 69
Claims and claim adjustment expense
reserves ...................... $26,530 $24,889 $51,419 $25,872 $25,734 $51,606
(1) Includes impact from certain reclassifications made to 2010 amounts to conform to 2011
presentation.
The $187 million decrease in gross claims and claim adjustment expense reserves since
December 31, 2010 primarily reflected the impact of net favorable prior year reserve development and
payments related to operations in runoff, including asbestos and environmental claims, partially offset
by the significant catastrophe losses incurred in 2011 and growth in business volume.
Asbestos and environmental reserves are included in the General liability, Commercial multi-peril
and International and other lines in the foregoing summary table. Asbestos and environmental reserves
are discussed separately; see ‘‘Asbestos Claims and Litigation’’, ‘‘Environmental Claims and Litigation’’
and ‘‘Uncertainty Regarding Adequacy of Asbestos and Environmental Reserves.’’
Claims and claim adjustment expense reserves represent management’s estimate of ultimate unpaid
costs of losses and loss adjustment expenses for claims that have been reported and claims that have
been incurred but not yet reported (IBNR). Claims and claim adjustment expense reserves do not
represent an exact calculation of liability, but instead represent management estimates, generally
utilizing actuarial expertise and projection techniques, at a given accounting date. These estimates are
128