Travelers 2011 Annual Report Download - page 100
Download and view the complete annual report
Please find page 100 of the 2011 Travelers annual report below. You can navigate through the pages in the report by either clicking on the pages listed below, or by using the keyword search tool below to find specific information within the annual report.-
 1
1 -
2
-
3
-
4
-
5
-
6
-
7
-
8
-
9
-
10
-
11
-
12
-
13
-
14
-
15
-
16
-
17
-
18
-
19
-
20
-
21
-
22
-
23
-
24
-
25
-
26
-
27
-
28
-
29
-
30
-
31
-
32
-
33
-
34
-
35
-
36
-
37
-
38
-
39
-
40
-
41
-
42
-
43
-
44
-
45
-
46
-
47
-
48
-
49
-
50
-
51
-
52
-
53
-
54
-
55
-
56
-
57
-
58
-
59
-
60
-
61
-
62
-
63
-
64
-
65
-
66
-
67
-
68
-
69
-
70
-
71
-
72
-
73
-
74
-
75
-
76
-
77
-
78
-
79
-
80
-
81
-
82
-
83
-
84
-
85
-
86
-
87
-
88
-
89
-
 90
90 -
 91
91 -
 92
92 -
 93
93 -
 94
94 -
 95
95 -
 96
96 -
 97
97 -
 98
98 -
 99
99 -
 100
100 -
 101
101 -
 102
102 -
 103
103 -
 104
104 -
 105
105 -
 106
106 -
 107
107 -
 108
108 -
 109
109 -
 110
110 -
111
-
112
-
113
-
114
-
115
-
116
-
117
-
118
-
119
-
120
-
121
-
122
-
123
-
124
-
125
-
126
-
127
-
128
-
129
-
130
-
131
-
132
-
133
-
134
-
135
-
136
-
137
-
138
-
139
-
140
-
141
-
142
-
143
-
144
-
145
-
146
-
147
-
148
-
149
-
150
-
151
-
152
-
153
-
154
-
155
-
156
-
157
-
158
-
159
-
160
-
161
-
162
-
163
-
164
-
165
-
166
-
167
-
168
-
169
-
170
-
171
-
172
-
173
-
174
-
175
-
176
-
177
-
178
-
179
-
180
-
181
-
182
-
183
-
184
-
185
-
186
-
187
-
188
-
189
-
190
-
191
-
192
-
193
-
194
-
195
-
196
-
197
-
198
-
199
-
200
-
201
-
202
-
203
-
204
-
205
-
206
-
207
-
208
-
209
-
210
-
211
-
212
-
213
-
214
-
215
-
216
-
217
-
218
-
219
-
220
-
221
-
222
-
223
-
224
-
225
-
226
-
227
-
228
-
229
-
230
-
231
-
232
-
233
-
234
-
235
-
236
-
237
-
238
-
239
-
240
-
241
-
242
-
243
-
244
-
245
-
246
-
247
-
248
-
249
-
250
-
251
-
252
-
253
-
254
-
255
-
256
-
257
-
258
-
259
-
260
-
261
-
262
-
263
-
264
-
265
-
266
-
267
-
268
-
269
-
270
-
271
-
272
-
273
-
274
-
275
-
276
-
277
-
278
-
279
-
280
-
281
-
282
-
283
-
284
-
285
-
286
-
287
-
288
-
289
-
290
-
291
-
292
-
293
 |
 |

Net written premiums of $1.23 billion in International in 2010 were $15 million, or 1%, lower than
in 2009, primarily reflecting the impact of intentional underwriting actions and competitive market
conditions. Those factors were largely offset by changes in the structure of the Company’s reinsurance
that modestly increased retentions to directionally align retentions in the Company’s International
business with its U.S. practices, as well as the favorable impact of foreign currency exchange rates. In
late 2008, the Company commenced an exclusive relationship with a broker in the Republic of Ireland
that significantly increased the 2009 volume of personal automobile coverage written and also resulted
in the Company writing personal household coverages. The Company ceased writing business through
this relationship in the fourth quarter of 2010. Excluding the surety line of business, retention rates in
2010 declined from 2009. New business volume also declined in 2010, primarily due to intentional
underwriting actions and the termination of a broker relationship in the Republic of Ireland. Renewal
premium changes were slightly positive in 2010, driven by positive renewal rate changes, partially offset
by reduced insured exposures.
Personal Insurance
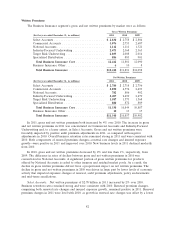
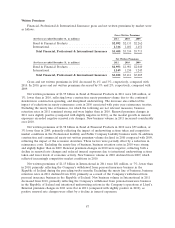
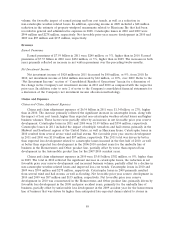
Results of the Company’s Personal Insurance segment were as follows:
(for the year ended December 31, in millions) 2011 2010 2009
Revenues:
Earned premiums ............................ $7,589 $7,349 $7,117
Net investment income ........................ 424 464 422
Other revenues .............................. 70 75 84
Total revenues ............................... $8,083 $7,888 $7,623
Total claims and expenses ........................ $8,708 $7,314 $6,824
Operating income (loss) ......................... $ (332) $ 440 $ 601
Loss and loss adjustment expense ratio .............. 83.5% 68.1% 65.0%
Underwriting expense ratio ....................... 30.1 30.2 29.6
GAAP combined ratio ......................... 113.6% 98.3% 94.6%
Incremental impact of direct to consumer initiative on
GAAP combined ratio ....................... 2.5% 2.2% 1.7%
Overview
An operating loss of ($332) million in 2011 compared with operating income of $440 million in
2010. This decline in operating income was primarily driven by a significant increase in catastrophe
losses, along with lower underlying underwriting margins related to earned pricing and loss cost trends,
higher than expected non-catastrophe weather-related losses, lower net investment income and an
increase in expenses related to the Company’s direct to consumer initiative. These factors were partially
offset by the favorable impact of increased business volumes, an increase in net favorable prior year
reserve development and a $10 million benefit resulting from the favorable resolution of various prior
year tax matters. Catastrophe losses in 2011 were $1.49 billion, compared with $594 million in 2010.
Net favorable prior year reserve development in 2011 was $110 million, compared with $87 million in
2010.
In 2010, operating income of $440 million was $161 million, or 27%, lower than in 2009. The
decline primarily reflected the significant increase in catastrophe losses, a decline in net favorable prior
year reserve development and an increase in expenses related to the Company’s direct to consumer
initiative. These factors were partially offset by increases in net investment income and business
88