Travelers 2011 Annual Report Download - page 241
Download and view the complete annual report
Please find page 241 of the 2011 Travelers annual report below. You can navigate through the pages in the report by either clicking on the pages listed below, or by using the keyword search tool below to find specific information within the annual report.-
 1
1 -
2
-
3
-
4
-
5
-
6
-
7
-
8
-
9
-
10
-
11
-
12
-
13
-
14
-
15
-
16
-
17
-
18
-
19
-
20
-
21
-
22
-
23
-
24
-
25
-
26
-
27
-
28
-
29
-
30
-
31
-
32
-
33
-
34
-
35
-
36
-
37
-
38
-
39
-
40
-
41
-
42
-
43
-
44
-
45
-
46
-
47
-
48
-
49
-
50
-
51
-
52
-
53
-
54
-
55
-
56
-
57
-
58
-
59
-
60
-
61
-
62
-
63
-
64
-
65
-
66
-
67
-
68
-
69
-
70
-
71
-
72
-
73
-
74
-
75
-
76
-
77
-
78
-
79
-
80
-
81
-
82
-
83
-
84
-
85
-
86
-
87
-
88
-
89
-
90
-
91
-
92
-
93
-
94
-
95
-
96
-
97
-
98
-
99
-
100
-
101
-
102
-
103
-
104
-
105
-
106
-
107
-
108
-
109
-
110
-
111
-
112
-
113
-
114
-
115
-
116
-
117
-
118
-
119
-
120
-
121
-
122
-
123
-
124
-
125
-
126
-
127
-
128
-
129
-
130
-
131
-
132
-
133
-
134
-
135
-
136
-
137
-
138
-
139
-
140
-
141
-
142
-
143
-
144
-
145
-
146
-
147
-
148
-
149
-
150
-
151
-
152
-
153
-
154
-
155
-
156
-
157
-
158
-
159
-
160
-
161
-
162
-
163
-
164
-
165
-
166
-
167
-
168
-
169
-
170
-
171
-
172
-
173
-
174
-
175
-
176
-
177
-
178
-
179
-
180
-
181
-
182
-
183
-
184
-
185
-
186
-
187
-
188
-
189
-
190
-
191
-
192
-
193
-
194
-
195
-
196
-
197
-
198
-
199
-
200
-
201
-
202
-
203
-
204
-
205
-
206
-
207
-
208
-
209
-
210
-
211
-
212
-
213
-
214
-
215
-
216
-
217
-
218
-
219
-
220
-
221
-
222
-
223
-
224
-
225
-
226
-
227
-
228
-
229
-
230
-
 231
231 -
 232
232 -
 233
233 -
 234
234 -
 235
235 -
 236
236 -
 237
237 -
 238
238 -
 239
239 -
 240
240 -
 241
241 -
 242
242 -
 243
243 -
 244
244 -
 245
245 -
 246
246 -
 247
247 -
 248
248 -
 249
249 -
 250
250 -
 251
251 -
252
-
253
-
254
-
255
-
256
-
257
-
258
-
259
-
260
-
261
-
262
-
263
-
264
-
265
-
266
-
267
-
268
-
269
-
270
-
271
-
272
-
273
-
274
-
275
-
276
-
277
-
278
-
279
-
280
-
281
-
282
-
283
-
284
-
285
-
286
-
287
-
288
-
289
-
290
-
291
-
292
-
293
 |
 |

THE TRAVELERS COMPANIES, INC. AND SUBSIDIARIES
NOTES TO CONSOLIDATED FINANCIAL STATEMENTS (Continued)
13. PENSION PLANS, RETIREMENT BENEFITS AND SAVINGS PLANS (Continued)
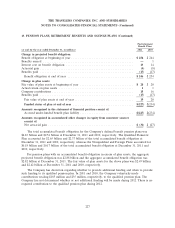
Assumptions and Health Care Cost Trend Rate Sensitivity
(at and for the year ended December 31,) 2011 2010
Assumptions used to determine benefit obligations
Discount rate ....................................................... 4.90% 5.37%
Future compensation increase rate ........................................ 4.00% 4.00%
Assumptions used to determine net periodic benefit cost
Discount rate ....................................................... 5.37% 5.55%
Expected long-term rate of return on pension plans’ assets ...................... 8.00% 8.00%
Expected long-term rate of return on postretirement benefit plans’ assets ............ 5.00% 5.00%
Assumed health care cost trend rates
Following year ....................................................... 8.00% 8.50%
Rate to which the cost trend rate is assumed to decline (ultimate trend rate) ......... 5.00% 5.00%
Year that the rate reaches the ultimate trend rate ............................. 2018 2018
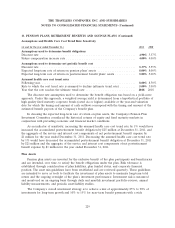
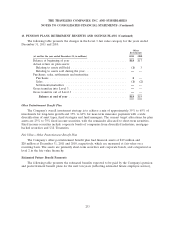
The discount rate assumption used to determine the benefit obligation was based on a yield-curve
approach. Under this approach, a weighted average yield is determined from a hypothetical portfolio of
high quality fixed maturity corporate bonds (rated Aa or higher) available at the year-end valuation
date for which the timing and amount of cash outflows correspond with the timing and amount of the
estimated benefit payouts of the Company’s benefit plan.
In choosing the expected long-term rate of return on plan assets, the Company’s Pension Plan
Investment Committee considered the historical returns of equity and fixed maturity markets in
conjunction with prevailing economic and financial market conditions.
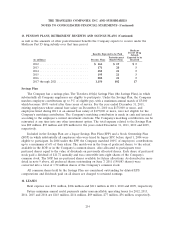
As an indicator of sensitivity, increasing the assumed health care cost trend rate by 1% would have
increased the accumulated postretirement benefit obligation by $25 million at December 31, 2011, and
the aggregate of the service and interest cost components of net postretirement benefit expense by
$1 million for the year ended December 31, 2011. Decreasing the assumed health care cost trend rate
by 1% would have decreased the accumulated postretirement benefit obligation at December 31, 2011
by $21 million and the aggregate of the service and interest cost components of net postretirement
benefit expense by $1 million for the year ended December 31, 2011.
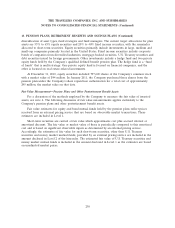
Plan Assets
Pension plan assets are invested for the exclusive benefit of the plan participants and beneficiaries
and are intended, over time, to satisfy the benefit obligations under the plan. Risk tolerance is
established through consideration of plan liabilities, plan funded status, and corporate financial
position. The asset mix guidelines have been established and are reviewed quarterly. These guidelines
are intended to serve as tools to facilitate the investment of plan assets to maximize long-term total
return and the ongoing oversight of the plan’s investment performance. Investment risk is measured
and monitored on an ongoing basis through daily and monthly investment portfolio reviews, annual
liability measurements, and periodic asset/liability studies.
The Company’s overall investment strategy is to achieve a mix of approximately 85% to 90% of
investments for long-term growth and 10% to 15% for near-term benefit payments with a wide
229