Travelers 2011 Annual Report Download - page 94
Download and view the complete annual report
Please find page 94 of the 2011 Travelers annual report below. You can navigate through the pages in the report by either clicking on the pages listed below, or by using the keyword search tool below to find specific information within the annual report.-
 1
1 -
2
-
3
-
4
-
5
-
6
-
7
-
8
-
9
-
10
-
11
-
12
-
13
-
14
-
15
-
16
-
17
-
18
-
19
-
20
-
21
-
22
-
23
-
24
-
25
-
26
-
27
-
28
-
29
-
30
-
31
-
32
-
33
-
34
-
35
-
36
-
37
-
38
-
39
-
40
-
41
-
42
-
43
-
44
-
45
-
46
-
47
-
48
-
49
-
50
-
51
-
52
-
53
-
54
-
55
-
56
-
57
-
58
-
59
-
60
-
61
-
62
-
63
-
64
-
65
-
66
-
67
-
68
-
69
-
70
-
71
-
72
-
73
-
74
-
75
-
76
-
77
-
78
-
79
-
80
-
81
-
82
-
83
-
 84
84 -
 85
85 -
 86
86 -
 87
87 -
 88
88 -
 89
89 -
 90
90 -
 91
91 -
 92
92 -
 93
93 -
 94
94 -
 95
95 -
 96
96 -
 97
97 -
 98
98 -
 99
99 -
 100
100 -
 101
101 -
 102
102 -
 103
103 -
 104
104 -
105
-
106
-
107
-
108
-
109
-
110
-
111
-
112
-
113
-
114
-
115
-
116
-
117
-
118
-
119
-
120
-
121
-
122
-
123
-
124
-
125
-
126
-
127
-
128
-
129
-
130
-
131
-
132
-
133
-
134
-
135
-
136
-
137
-
138
-
139
-
140
-
141
-
142
-
143
-
144
-
145
-
146
-
147
-
148
-
149
-
150
-
151
-
152
-
153
-
154
-
155
-
156
-
157
-
158
-
159
-
160
-
161
-
162
-
163
-
164
-
165
-
166
-
167
-
168
-
169
-
170
-
171
-
172
-
173
-
174
-
175
-
176
-
177
-
178
-
179
-
180
-
181
-
182
-
183
-
184
-
185
-
186
-
187
-
188
-
189
-
190
-
191
-
192
-
193
-
194
-
195
-
196
-
197
-
198
-
199
-
200
-
201
-
202
-
203
-
204
-
205
-
206
-
207
-
208
-
209
-
210
-
211
-
212
-
213
-
214
-
215
-
216
-
217
-
218
-
219
-
220
-
221
-
222
-
223
-
224
-
225
-
226
-
227
-
228
-
229
-
230
-
231
-
232
-
233
-
234
-
235
-
236
-
237
-
238
-
239
-
240
-
241
-
242
-
243
-
244
-
245
-
246
-
247
-
248
-
249
-
250
-
251
-
252
-
253
-
254
-
255
-
256
-
257
-
258
-
259
-
260
-
261
-
262
-
263
-
264
-
265
-
266
-
267
-
268
-
269
-
270
-
271
-
272
-
273
-
274
-
275
-
276
-
277
-
278
-
279
-
280
-
281
-
282
-
283
-
284
-
285
-
286
-
287
-
288
-
289
-
290
-
291
-
292
-
293
 |
 |

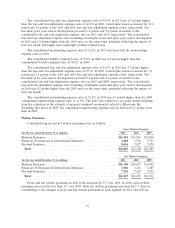
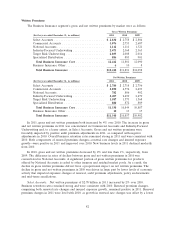
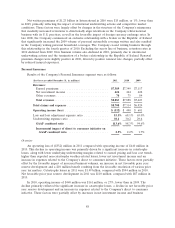
Written Premiums
The Business Insurance segment’s gross and net written premiums by market were as follows:
Gross Written Premiums
(for the year ended December 31, in millions) 2011 2010 2009
Select Accounts ............................. $ 2,830 $ 2,758 $ 2,804
Commercial Accounts ........................ 3,076 2,753 2,687
National Accounts ........................... 1,112 1,111 1,321
Industry-Focused Underwriting .................. 2,473 2,368 2,363
Target Risk Underwriting ...................... 2,035 2,008 2,014
Specialized Distribution ....................... 886 883 901
Total Business Insurance Core ................ 12,412 11,881 12,090
Business Insurance Other ...................... 610 8
Total Business Insurance .................... $12,418 $11,891 $12,098
Net Written Premiums
(for the year ended December 31, in millions) 2011 2010 2009
Select Accounts ............................. $ 2,784 $ 2,718 $ 2,756
Commercial Accounts ........................ 2,890 2,576 2,493
National Accounts ........................... 782 806 902
Industry-Focused Underwriting .................. 2,407 2,299 2,279
Target Risk Underwriting ...................... 1,587 1,573 1,568
Specialized Distribution ....................... 880 872 889
Total Business Insurance Core ................ 11,330 10,844 10,887
Business Insurance Other ...................... 10 13 15
Total Business Insurance .................... $11,340 $10,857 $10,902
In 2011, gross and net written premiums both increased by 4% over 2010. The increase in gross
and net written premiums in 2011 was concentrated in Commercial Accounts and Industry-Focused
Underwriting and, to a lesser extent, in Select Accounts. Gross and net written premiums were
favorably impacted by positive audit premium adjustments in 2011, as compared with negative
adjustments in 2010. Overall business retention rates remained strong in 2011 and were consistent with
2010. Both components of renewal premium changes—renewal rate changes and insured exposure
growth—were positive in 2011 and improved over 2010. New business levels in 2011 declined modestly
from 2010.
In 2010, gross and net written premiums decreased by 2% and less than 1%, respectively, from
2009. The difference in rates of decline between gross and net written premiums in 2010 was
concentrated in National Accounts. A significant portion of gross written premiums for products
offered by National Accounts is ceded to other insurers and residual market pools. As a result, the
decline in gross written premiums did not have a proportional impact on net written premiums. The
decline in gross and net written premiums in 2010 was driven in large part by lower levels of economic
activity that impacted exposure changes at renewal, audit premium adjustments, policy endorsements
and mid-term cancellations.
Select Accounts. Net written premiums of $2.78 billion in 2011 increased by 2% over 2010.
Business retention rates remained strong and were consistent with 2010. Renewal premium changes,
comprising both renewal rate changes and insured exposure growth, remained positive in 2011. Renewal
premium changes in 2011 were level with 2010, as growth in renewal rate changes was offset by a lower
82