Travelers 2011 Annual Report Download - page 261
Download and view the complete annual report
Please find page 261 of the 2011 Travelers annual report below. You can navigate through the pages in the report by either clicking on the pages listed below, or by using the keyword search tool below to find specific information within the annual report.-
 1
1 -
2
-
3
-
4
-
5
-
6
-
7
-
8
-
9
-
10
-
11
-
12
-
13
-
14
-
15
-
16
-
17
-
18
-
19
-
20
-
21
-
22
-
23
-
24
-
25
-
26
-
27
-
28
-
29
-
30
-
31
-
32
-
33
-
34
-
35
-
36
-
37
-
38
-
39
-
40
-
41
-
42
-
43
-
44
-
45
-
46
-
47
-
48
-
49
-
50
-
51
-
52
-
53
-
54
-
55
-
56
-
57
-
58
-
59
-
60
-
61
-
62
-
63
-
64
-
65
-
66
-
67
-
68
-
69
-
70
-
71
-
72
-
73
-
74
-
75
-
76
-
77
-
78
-
79
-
80
-
81
-
82
-
83
-
84
-
85
-
86
-
87
-
88
-
89
-
90
-
91
-
92
-
93
-
94
-
95
-
96
-
97
-
98
-
99
-
100
-
101
-
102
-
103
-
104
-
105
-
106
-
107
-
108
-
109
-
110
-
111
-
112
-
113
-
114
-
115
-
116
-
117
-
118
-
119
-
120
-
121
-
122
-
123
-
124
-
125
-
126
-
127
-
128
-
129
-
130
-
131
-
132
-
133
-
134
-
135
-
136
-
137
-
138
-
139
-
140
-
141
-
142
-
143
-
144
-
145
-
146
-
147
-
148
-
149
-
150
-
151
-
152
-
153
-
154
-
155
-
156
-
157
-
158
-
159
-
160
-
161
-
162
-
163
-
164
-
165
-
166
-
167
-
168
-
169
-
170
-
171
-
172
-
173
-
174
-
175
-
176
-
177
-
178
-
179
-
180
-
181
-
182
-
183
-
184
-
185
-
186
-
187
-
188
-
189
-
190
-
191
-
192
-
193
-
194
-
195
-
196
-
197
-
198
-
199
-
200
-
201
-
202
-
203
-
204
-
205
-
206
-
207
-
208
-
209
-
210
-
211
-
212
-
213
-
214
-
215
-
216
-
217
-
218
-
219
-
220
-
221
-
222
-
223
-
224
-
225
-
226
-
227
-
228
-
229
-
230
-
231
-
232
-
233
-
234
-
235
-
236
-
237
-
238
-
239
-
240
-
241
-
242
-
243
-
244
-
245
-
246
-
247
-
248
-
249
-
250
-
 251
251 -
 252
252 -
 253
253 -
 254
254 -
 255
255 -
 256
256 -
 257
257 -
 258
258 -
 259
259 -
 260
260 -
 261
261 -
 262
262 -
 263
263 -
 264
264 -
 265
265 -
 266
266 -
 267
267 -
 268
268 -
 269
269 -
 270
270 -
 271
271 -
272
-
273
-
274
-
275
-
276
-
277
-
278
-
279
-
280
-
281
-
282
-
283
-
284
-
285
-
286
-
287
-
288
-
289
-
290
-
291
-
292
-
293
 |
 |

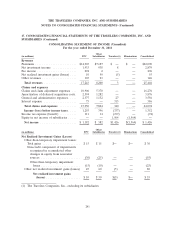
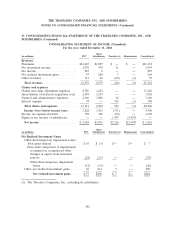
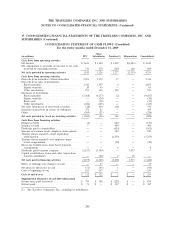
THE TRAVELERS COMPANIES, INC. AND SUBSIDIARIES
NOTES TO CONSOLIDATED FINANCIAL STATEMENTS (Continued)
18. SELECTED QUARTERLY FINANCIAL DATA (Unaudited)
First Second Third Fourth
2011 (in millions, except per share amounts) Quarter Quarter Quarter Quarter Total
Total revenues ............................... $6,278 $6,388 $6,407 $6,373 $25,446
Total expenses ............................... 5,309 7,115 6,075 5,595 24,094
Income (loss) before income taxes ................. 969 (727) 332 778 1,352
Income tax expense (benefit) ..................... 130 (363) (1) 160 (74)
Net income (loss) ............................. $ 839 $ (364) $ 333 $ 618 $ 1,426
Net income (loss) per share(1):
Basic .................................... $ 1.94 $(0.88) $ 0.80 $ 1.52 $ 3.40
Diluted ................................... 1.92 (0.88) 0.79 1.51 3.36
First Second Third Fourth
2010 (in millions, except per share amounts) Quarter Quarter Quarter Quarter Total
Total revenues ............................... $6,119 $6,179 $6,482 $6,332 $25,112
Total expenses ............................... 5,262 5,298 5,111 5,135 20,806
Income before income taxes ..................... 857 881 1,371 1,197 4,306
Income tax expense ........................... 210 211 366 303 1,090
Net income ................................. $ 647 $ 670 $1,005 $ 894 $ 3,216
Net income per share(1):
Basic .................................... $ 1.26 $ 1.37 $ 2.14 $ 1.98 $ 6.69
Diluted ................................... 1.25 1.35 2.11 1.95 6.62
(1) Due to the averaging of shares, quarterly earnings per share may not add to the total for the full
year.
249