Travelers 2011 Annual Report Download - page 97
Download and view the complete annual report
Please find page 97 of the 2011 Travelers annual report below. You can navigate through the pages in the report by either clicking on the pages listed below, or by using the keyword search tool below to find specific information within the annual report.-
 1
1 -
2
-
3
-
4
-
5
-
6
-
7
-
8
-
9
-
10
-
11
-
12
-
13
-
14
-
15
-
16
-
17
-
18
-
19
-
20
-
21
-
22
-
23
-
24
-
25
-
26
-
27
-
28
-
29
-
30
-
31
-
32
-
33
-
34
-
35
-
36
-
37
-
38
-
39
-
40
-
41
-
42
-
43
-
44
-
45
-
46
-
47
-
48
-
49
-
50
-
51
-
52
-
53
-
54
-
55
-
56
-
57
-
58
-
59
-
60
-
61
-
62
-
63
-
64
-
65
-
66
-
67
-
68
-
69
-
70
-
71
-
72
-
73
-
74
-
75
-
76
-
77
-
78
-
79
-
80
-
81
-
82
-
83
-
84
-
85
-
86
-
 87
87 -
 88
88 -
 89
89 -
 90
90 -
 91
91 -
 92
92 -
 93
93 -
 94
94 -
 95
95 -
 96
96 -
 97
97 -
 98
98 -
 99
99 -
 100
100 -
 101
101 -
 102
102 -
 103
103 -
 104
104 -
 105
105 -
 106
106 -
 107
107 -
108
-
109
-
110
-
111
-
112
-
113
-
114
-
115
-
116
-
117
-
118
-
119
-
120
-
121
-
122
-
123
-
124
-
125
-
126
-
127
-
128
-
129
-
130
-
131
-
132
-
133
-
134
-
135
-
136
-
137
-
138
-
139
-
140
-
141
-
142
-
143
-
144
-
145
-
146
-
147
-
148
-
149
-
150
-
151
-
152
-
153
-
154
-
155
-
156
-
157
-
158
-
159
-
160
-
161
-
162
-
163
-
164
-
165
-
166
-
167
-
168
-
169
-
170
-
171
-
172
-
173
-
174
-
175
-
176
-
177
-
178
-
179
-
180
-
181
-
182
-
183
-
184
-
185
-
186
-
187
-
188
-
189
-
190
-
191
-
192
-
193
-
194
-
195
-
196
-
197
-
198
-
199
-
200
-
201
-
202
-
203
-
204
-
205
-
206
-
207
-
208
-
209
-
210
-
211
-
212
-
213
-
214
-
215
-
216
-
217
-
218
-
219
-
220
-
221
-
222
-
223
-
224
-
225
-
226
-
227
-
228
-
229
-
230
-
231
-
232
-
233
-
234
-
235
-
236
-
237
-
238
-
239
-
240
-
241
-
242
-
243
-
244
-
245
-
246
-
247
-
248
-
249
-
250
-
251
-
252
-
253
-
254
-
255
-
256
-
257
-
258
-
259
-
260
-
261
-
262
-
263
-
264
-
265
-
266
-
267
-
268
-
269
-
270
-
271
-
272
-
273
-
274
-
275
-
276
-
277
-
278
-
279
-
280
-
281
-
282
-
283
-
284
-
285
-
286
-
287
-
288
-
289
-
290
-
291
-
292
-
293
 |
 |
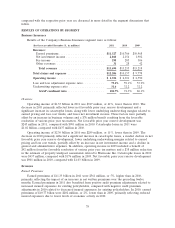
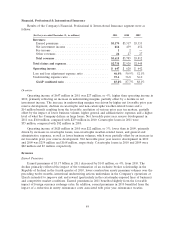
Earned premiums of $3.32 billion in 2010 were slightly lower than in 2009, primarily reflecting the
impact of intentional underwriting actions taken and competitive market conditions in the Professional
Liability business unit and in the Company’s operation at Lloyd’s. These factors were largely offset by
lower reinsurance costs, the impact of changes in the structure of the Company’s reinsurance during
the first quarter of 2010 that modestly increased retentions to directionally align retentions in the
Company’s International business with its U.S. practices, and the favorable impact of foreign currency
exchange rates.
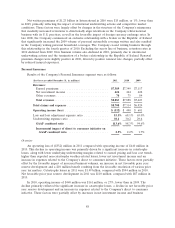
Net Investment Income
Net investment income of $414 million in 2011 decreased by $25 million, or 6%, compared with
2010. In 2010, net investment income of $439 million declined by $13 million, or 3%, from 2009.
Included in the Financial, Professional & International Insurance segment are certain legal entities
whose invested assets and related net investment income are reported exclusively in this segment and
not allocated among all business segments. As a result, reported net investment income in the
Financial, Professional & International Insurance segment reflects a significantly smaller proportion of
allocated net investment income, including that from the Company’s non-fixed maturity investments
that experienced a substantial increase in investment income in 2010. Refer to the ‘‘Net Investment
Income’’ section of ‘‘Consolidated Results of Operations’’ herein for a discussion of the change in the
Company’s consolidated net investment income in 2011 and 2010 as compared with the respective prior
years. In addition, refer to note 2 of notes to the Company’s consolidated financial statements for a
discussion of the Company’s net investment income allocation methodology.
Claims and Expenses
Claims and Claim Adjustment Expenses
Claims and claim adjustment expenses in 2011 were $1.49 billion, $213 million, or 13%, lower than
in 2010, primarily reflecting an increase in net favorable prior year reserve development, a decline in
catastrophe losses, lower non-catastrophe weather-related losses and lower business volume, partially
offset by a higher level of large losses. Net favorable prior year reserve development was $360 million
and $259 million in 2011 and 2010, respectively. Both Bond & Financial Products and International
contributed to the net favorable prior year reserve development in 2011. In Bond & Financial Products,
net favorable development in 2011 primarily reflected better than expected results for accident years
2008 and prior for the contract surety business, and better than expected loss development for liability
lines of business, driven by the fiduciary product for accident years 2008 and prior. In International, net
favorable development in 2011 reflected better than expected loss development in Canada, primarily in
the surety, directors and officers, and general liability lines of business for recent accident years and
better than expected development in the Company’s operation at Lloyd’s in the aviation, kidnap &
ransom, and property lines for recent accident years. Catastrophe losses in 2011 were $55 million,
compared with $82 million in 2010. Catastrophe losses in 2011 included losses from floods in Thailand
and an earthquake in Japan. Catastrophe losses in 2010 primarily resulted from an earthquake in Chile.
Claims and claim adjustment expenses in 2010 were $1.70 billion, $47 million, or 3%, lower than in
2009, primarily reflecting an increase in net favorable prior year reserve development, partially offset by
increases in catastrophe losses and non-catastrophe weather-related losses. In addition, the 2009 total
included an increase in reserves for a non-renewed professional liability program in the Republic of
Ireland. Net favorable prior year reserve development was $259 million and $168 million in 2010 and
2009, respectively. In Bond & Financial Products, net favorable prior year reserve development in 2010
was driven by better than expected loss development in the surety and management liability lines of
business due to lower than expected claim activity and loss severity in the 2008 and prior accident
years. In International, the majority of net favorable prior year reserve development in 2010 occurred
at the Company’s operation at Lloyd’s, in Canada and in the United Kingdom. Net favorable prior year
85