Travelers 2011 Annual Report Download - page 85
Download and view the complete annual report
Please find page 85 of the 2011 Travelers annual report below. You can navigate through the pages in the report by either clicking on the pages listed below, or by using the keyword search tool below to find specific information within the annual report.-
 1
1 -
2
-
3
-
4
-
5
-
6
-
7
-
8
-
9
-
10
-
11
-
12
-
13
-
14
-
15
-
16
-
17
-
18
-
19
-
20
-
21
-
22
-
23
-
24
-
25
-
26
-
27
-
28
-
29
-
30
-
31
-
32
-
33
-
34
-
35
-
36
-
37
-
38
-
39
-
40
-
41
-
42
-
43
-
44
-
45
-
46
-
47
-
48
-
49
-
50
-
51
-
52
-
53
-
54
-
55
-
56
-
57
-
58
-
59
-
60
-
61
-
62
-
63
-
64
-
65
-
66
-
67
-
68
-
69
-
70
-
71
-
72
-
73
-
74
-
 75
75 -
 76
76 -
 77
77 -
 78
78 -
 79
79 -
 80
80 -
 81
81 -
 82
82 -
 83
83 -
 84
84 -
 85
85 -
 86
86 -
 87
87 -
 88
88 -
 89
89 -
 90
90 -
 91
91 -
 92
92 -
 93
93 -
 94
94 -
 95
95 -
96
-
97
-
98
-
99
-
100
-
101
-
102
-
103
-
104
-
105
-
106
-
107
-
108
-
109
-
110
-
111
-
112
-
113
-
114
-
115
-
116
-
117
-
118
-
119
-
120
-
121
-
122
-
123
-
124
-
125
-
126
-
127
-
128
-
129
-
130
-
131
-
132
-
133
-
134
-
135
-
136
-
137
-
138
-
139
-
140
-
141
-
142
-
143
-
144
-
145
-
146
-
147
-
148
-
149
-
150
-
151
-
152
-
153
-
154
-
155
-
156
-
157
-
158
-
159
-
160
-
161
-
162
-
163
-
164
-
165
-
166
-
167
-
168
-
169
-
170
-
171
-
172
-
173
-
174
-
175
-
176
-
177
-
178
-
179
-
180
-
181
-
182
-
183
-
184
-
185
-
186
-
187
-
188
-
189
-
190
-
191
-
192
-
193
-
194
-
195
-
196
-
197
-
198
-
199
-
200
-
201
-
202
-
203
-
204
-
205
-
206
-
207
-
208
-
209
-
210
-
211
-
212
-
213
-
214
-
215
-
216
-
217
-
218
-
219
-
220
-
221
-
222
-
223
-
224
-
225
-
226
-
227
-
228
-
229
-
230
-
231
-
232
-
233
-
234
-
235
-
236
-
237
-
238
-
239
-
240
-
241
-
242
-
243
-
244
-
245
-
246
-
247
-
248
-
249
-
250
-
251
-
252
-
253
-
254
-
255
-
256
-
257
-
258
-
259
-
260
-
261
-
262
-
263
-
264
-
265
-
266
-
267
-
268
-
269
-
270
-
271
-
272
-
273
-
274
-
275
-
276
-
277
-
278
-
279
-
280
-
281
-
282
-
283
-
284
-
285
-
286
-
287
-
288
-
289
-
290
-
291
-
292
-
293
 |
 |

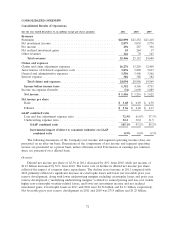
respectively. Net income in 2011 benefited from a reduction in income tax expense of $104 million
resulting from the favorable resolution of various prior year tax matters.
Diluted net income per share of $6.62 in 2010 increased by 5% over 2009, despite a decrease in
reported net income, due to the favorable impact of common share repurchases. Net income of
$3.22 billion in 2010 was $406 million lower than in 2009, primarily reflecting a significant increase in
catastrophe losses, a modest decline in net favorable prior year reserve development and reduced
underlying underwriting margins related to earned pricing and loss cost trends, partially offset by
increases in net investment income and net realized investment gains. Net income in 2009 reflected a
reduction in income tax expense of $89 million resulting from the favorable resolution of various prior
year tax matters and an $87 million reduction in the estimate of property windpool assessments related
to Hurricane Ike that had been recorded in general and administrative expenses in 2008. Catastrophe
losses in 2010 and 2009 were $1.11 billion and $457 million, respectively. Net favorable prior year
reserve development in 2010 and 2009 was $1.25 billion and $1.33 billion, respectively.
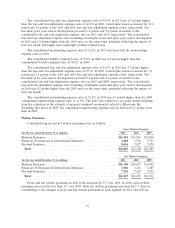
Revenues
Earned Premiums
Earned premiums of $22.09 billion in 2011 were $658 million, or 3%, higher than in 2010. In the
Business Insurance segment, earned premiums in 2011 increased by 5% over 2010. In the Financial,
Professional & International Insurance segment, earned premiums in 2011 decreased by 4% from 2010.
In the Personal Insurance segment, earned premiums in 2011 increased by 3% over 2010.
Earned premiums of $21.43 billion in 2010 were $14 million, or less than 1%, higher than in 2009.
In the Business Insurance segment, earned premiums in 2010 declined 2% from 2009. In the Financial,
Professional & International Insurance segment, earned premiums in 2010 decreased by less than 1%
from 2009. In the Personal Insurance segment, earned premiums in 2010 increased 3% over 2009.
Factors contributing to the changes in earned premiums in each segment in 2011 and 2010
compared with the respective prior year are discussed in more detail in the segment discussions that
follow.
Net Investment Income
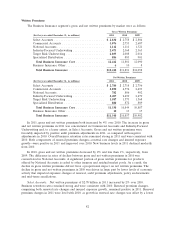
The following table sets forth information regarding the Company’s investments.
(for the year ended December 31, in millions) 2011 2010 2009
Average investments(1) ..................................... $70,471 $71,637 $73,130
Pretax net investment income ................................ 2,879 3,059 2,776
After-tax net investment income .............................. 2,330 2,468 2,290
Average pretax yield(2) .................................... 4.1% 4.3% 3.8%
Average after-tax yield(2) ................................... 3.3% 3.4% 3.1%
(1) Excludes net unrealized investment gains and losses, net of tax, and reflects cash, receivables for
investment sales, payables on investment purchases and accrued investment income.
(2) Excludes net realized investment gains and losses and net unrealized investment gains and losses.
Net investment income was $2.88 billion in 2011, $180 million, or 6%, lower than in 2010. Net
investment income from fixed maturity investments of $2.54 billion in 2011 declined by $167 million
compared with 2010, primarily resulting from lower long-term reinvestment yields available in the
market, as well as lower average levels of fixed maturity invested assets due to the Company’s common
share repurchases. Net investment income generated by non-fixed maturity investments of $355 million
in 2011 was $15 million lower than in 2010. The average pretax yield on the total investment portfolio
73