Travelers 2011 Annual Report Download - page 131
Download and view the complete annual report
Please find page 131 of the 2011 Travelers annual report below. You can navigate through the pages in the report by either clicking on the pages listed below, or by using the keyword search tool below to find specific information within the annual report.-
 1
1 -
2
-
3
-
4
-
5
-
6
-
7
-
8
-
9
-
10
-
11
-
12
-
13
-
14
-
15
-
16
-
17
-
18
-
19
-
20
-
21
-
22
-
23
-
24
-
25
-
26
-
27
-
28
-
29
-
30
-
31
-
32
-
33
-
34
-
35
-
36
-
37
-
38
-
39
-
40
-
41
-
42
-
43
-
44
-
45
-
46
-
47
-
48
-
49
-
50
-
51
-
52
-
53
-
54
-
55
-
56
-
57
-
58
-
59
-
60
-
61
-
62
-
63
-
64
-
65
-
66
-
67
-
68
-
69
-
70
-
71
-
72
-
73
-
74
-
75
-
76
-
77
-
78
-
79
-
80
-
81
-
82
-
83
-
84
-
85
-
86
-
87
-
88
-
89
-
90
-
91
-
92
-
93
-
94
-
95
-
96
-
97
-
98
-
99
-
100
-
101
-
102
-
103
-
104
-
105
-
106
-
107
-
108
-
109
-
110
-
111
-
112
-
113
-
114
-
115
-
116
-
117
-
118
-
119
-
120
-
 121
121 -
 122
122 -
 123
123 -
 124
124 -
 125
125 -
 126
126 -
 127
127 -
 128
128 -
 129
129 -
 130
130 -
 131
131 -
 132
132 -
 133
133 -
 134
134 -
 135
135 -
 136
136 -
 137
137 -
 138
138 -
 139
139 -
 140
140 -
 141
141 -
142
-
143
-
144
-
145
-
146
-
147
-
148
-
149
-
150
-
151
-
152
-
153
-
154
-
155
-
156
-
157
-
158
-
159
-
160
-
161
-
162
-
163
-
164
-
165
-
166
-
167
-
168
-
169
-
170
-
171
-
172
-
173
-
174
-
175
-
176
-
177
-
178
-
179
-
180
-
181
-
182
-
183
-
184
-
185
-
186
-
187
-
188
-
189
-
190
-
191
-
192
-
193
-
194
-
195
-
196
-
197
-
198
-
199
-
200
-
201
-
202
-
203
-
204
-
205
-
206
-
207
-
208
-
209
-
210
-
211
-
212
-
213
-
214
-
215
-
216
-
217
-
218
-
219
-
220
-
221
-
222
-
223
-
224
-
225
-
226
-
227
-
228
-
229
-
230
-
231
-
232
-
233
-
234
-
235
-
236
-
237
-
238
-
239
-
240
-
241
-
242
-
243
-
244
-
245
-
246
-
247
-
248
-
249
-
250
-
251
-
252
-
253
-
254
-
255
-
256
-
257
-
258
-
259
-
260
-
261
-
262
-
263
-
264
-
265
-
266
-
267
-
268
-
269
-
270
-
271
-
272
-
273
-
274
-
275
-
276
-
277
-
278
-
279
-
280
-
281
-
282
-
283
-
284
-
285
-
286
-
287
-
288
-
289
-
290
-
291
-
292
-
293
 |
 |
may also result in increased liquidity requirements. It is the opinion of the Company’s management
that the Company’s future liquidity needs will be adequately met from all of the above sources.
At December 31, 2011, total cash and short-term invested assets aggregating $2.39 billion and
having a weighted average maturity of 74 days were held in the United States by the holding company.
These assets are sufficient to meet the holding company’s current liquidity requirements and are more
than two times the Company’s minimum target level. These liquidity requirements primarily include
shareholder dividends, debt service and contributions to its qualified pension plan from time to time.
The holding company is not dependent on dividends or other forms of repatriation from its foreign
operations to support its liquidity needs. U.S. income taxes have not been recognized on $649 million
of the Company’s foreign operations’ undistributed earnings as of December 31, 2011, as such earnings
are intended to be permanently reinvested in those operations. Furthermore, taxes paid to foreign
governments on these earnings may be used as credits against the U.S. tax on dividend distributions if
such earnings were to be distributed to the holding company. The amount of undistributed earnings
from foreign operations and related taxes on those undistributed earnings were not material to the
Company’s financial position or liquidity at December 31, 2011.
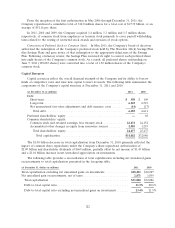
The Company has a shelf registration statement with the Securities and Exchange Commission
which permits it to issue securities from time to time. The Company also has a $1.0 billion line of
credit facility with a syndicate of financial institutions that expires in 2013. This line of credit also
supports the Company’s $800 million commercial paper program, of which $100 million was
outstanding at December 31, 2011. The Company is not reliant on its commercial paper program to
meet its operating cash flow needs.
The Company currently utilizes uncollateralized letters of credit issued by major banks with an
aggregate limit of approximately $432 million to provide much of the capital needed to support its
obligations at Lloyd’s. If uncollateralized letters of credit are not available at a reasonable price or at
all in the future, the Company can collateralize these letters of credit or may have to seek alternative
means of supporting its obligations at Lloyd’s, which could include utilizing holding company funds on
hand.
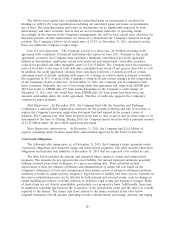
Operating Activities
Net cash flows provided by operating activities were $2.17 billion, $3.05 billion and $4.23 billion in
2011, 2010 and 2009, respectively. Cash flows in 2011 reflected an increase in losses paid related to
catastrophes and ongoing business (including the impact of increased loss costs), a higher level of
contributions to the Company’s qualified domestic pension plan and lower receipts related to net
investment income as compared with 2010. These factors were partially offset by a higher level of
collected premiums, a lower level of paid operating expenses and a lower level of paid losses related to
asbestos claims and operations in runoff. Cash flows in 2010 reflected a higher level of claims and
claim adjustment expense payments due to the impact of loss cost trends and a higher level of
catastrophe loss payments, as well as a lower level of reinsurance recoveries, partially offset by declines
in the amount of contributions to the Company’s qualified domestic pension plan and lower claims and
claim adjustment expense payments related to operations in runoff as compared with 2009. In the years
ended December 31, 2011, 2010 and 2009, the Company contributed $185 million, $35 million and
$260 million, respectively, to its qualified domestic pension plan.
Investing Activities
Net cash flows provided by investing activities were $1.15 billion and $2.11 billion in 2011 and
2010, respectively, compared with net cash flows used in investing activities of $899 million in 2009. The
Company’s consolidated total investments at December 31, 2011 decreased by $21 million from
year-end 2010, primarily reflecting the impact of the Company’s common share repurchases of
$2.90 billion under its share repurchase authorization and shareholder dividends of $665 million, largely
119