Travelers 2011 Annual Report Download - page 103
Download and view the complete annual report
Please find page 103 of the 2011 Travelers annual report below. You can navigate through the pages in the report by either clicking on the pages listed below, or by using the keyword search tool below to find specific information within the annual report.-
 1
1 -
2
-
3
-
4
-
5
-
6
-
7
-
8
-
9
-
10
-
11
-
12
-
13
-
14
-
15
-
16
-
17
-
18
-
19
-
20
-
21
-
22
-
23
-
24
-
25
-
26
-
27
-
28
-
29
-
30
-
31
-
32
-
33
-
34
-
35
-
36
-
37
-
38
-
39
-
40
-
41
-
42
-
43
-
44
-
45
-
46
-
47
-
48
-
49
-
50
-
51
-
52
-
53
-
54
-
55
-
56
-
57
-
58
-
59
-
60
-
61
-
62
-
63
-
64
-
65
-
66
-
67
-
68
-
69
-
70
-
71
-
72
-
73
-
74
-
75
-
76
-
77
-
78
-
79
-
80
-
81
-
82
-
83
-
84
-
85
-
86
-
87
-
88
-
89
-
90
-
91
-
92
-
 93
93 -
 94
94 -
 95
95 -
 96
96 -
 97
97 -
 98
98 -
 99
99 -
 100
100 -
 101
101 -
 102
102 -
 103
103 -
 104
104 -
 105
105 -
 106
106 -
 107
107 -
 108
108 -
 109
109 -
 110
110 -
 111
111 -
 112
112 -
 113
113 -
114
-
115
-
116
-
117
-
118
-
119
-
120
-
121
-
122
-
123
-
124
-
125
-
126
-
127
-
128
-
129
-
130
-
131
-
132
-
133
-
134
-
135
-
136
-
137
-
138
-
139
-
140
-
141
-
142
-
143
-
144
-
145
-
146
-
147
-
148
-
149
-
150
-
151
-
152
-
153
-
154
-
155
-
156
-
157
-
158
-
159
-
160
-
161
-
162
-
163
-
164
-
165
-
166
-
167
-
168
-
169
-
170
-
171
-
172
-
173
-
174
-
175
-
176
-
177
-
178
-
179
-
180
-
181
-
182
-
183
-
184
-
185
-
186
-
187
-
188
-
189
-
190
-
191
-
192
-
193
-
194
-
195
-
196
-
197
-
198
-
199
-
200
-
201
-
202
-
203
-
204
-
205
-
206
-
207
-
208
-
209
-
210
-
211
-
212
-
213
-
214
-
215
-
216
-
217
-
218
-
219
-
220
-
221
-
222
-
223
-
224
-
225
-
226
-
227
-
228
-
229
-
230
-
231
-
232
-
233
-
234
-
235
-
236
-
237
-
238
-
239
-
240
-
241
-
242
-
243
-
244
-
245
-
246
-
247
-
248
-
249
-
250
-
251
-
252
-
253
-
254
-
255
-
256
-
257
-
258
-
259
-
260
-
261
-
262
-
263
-
264
-
265
-
266
-
267
-
268
-
269
-
270
-
271
-
272
-
273
-
274
-
275
-
276
-
277
-
278
-
279
-
280
-
281
-
282
-
283
-
284
-
285
-
286
-
287
-
288
-
289
-
290
-
291
-
292
-
293
 |
 |

year reserve development was 1.8 points lower than the 2009 ratio on the same basis, primarily
reflecting lower non-catastrophe weather-related losses.
The underwriting expense ratio of 30.2% in 2010 was 0.6 points higher than the underwriting
expense ratio of 29.6% in 2009. The 2009 underwriting expense ratio included a 0.7 point benefit from
the reduction in the estimate of windpool assessments described above.
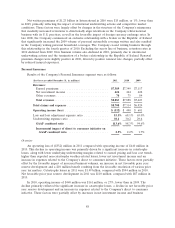
Agency Written Premiums
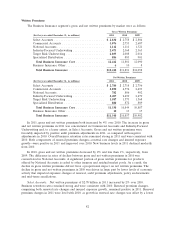
Gross and net written premiums by product line were as follows for the Personal Insurance
segment’s Agency business, which comprises business written through agents, brokers and other
intermediaries and represents almost all of the segment’s gross and net written premiums:
Gross Written Premiums
(for the year ended December 31, in millions) 2011 2010 2009
Agency Automobile ............................ $3,706 $3,720 $3,610
Agency Homeowners and Other ................... 4,221 4,060 3,809
Total Agency Personal Insurance ................. $7,927 $7,780 $7,419
Net Written Premiums
(for the year ended December 31, in millions) 2011 2010 2009
Agency Automobile ............................ $3,688 $3,698 $3,586
Agency Homeowners and Other ................... 3,923 3,772 3,508
Total Agency Personal Insurance ................. $7,611 $7,470 $7,094
In 2011, gross and net Agency written premiums both increased 2% over the respective totals in
2010. Gross and net Agency written premiums in 2010 both increased 5% over the respective totals in
2009.
In the Agency Automobile line of business, net written premiums in 2011 were slightly lower than
in 2010. Business retention rates remained strong, while new business levels in 2011 were lower than in
2010. Renewal premium changes remained positive in 2011 and increased over 2010. In 2010, net
written premiums in the Agency Automobile line of business increased 3% over 2009, primarily
reflecting the impact of the introduction of twelve-month policy terms in certain markets in 2010.
Excluding the impact of the change in policy terms in 2010, Agency Automobile net written premiums
were virtually level with 2009. Business retention rates in 2010 remained strong and new business levels
increased over 2009. Renewal premium changes were positive in 2010 but declined slightly from 2009.
In the Agency Homeowners and Other line of business, net written premiums in 2011 were 4%
higher than in 2010. Business retention rates remained strong, while new business levels in 2011 were
lower than in 2010. Renewal premium changes in 2011 remained positive and increased slightly over
2010. In 2010, net written premiums in the Agency Homeowners and Other line of business increased
8% over 2009, primarily driven by increases in renewal premium changes, business retention rates and
new business levels.
For its Agency business, the Personal Insurance segment had approximately 7.7 million and
7.6 million active policies at December 31, 2011 and 2010, respectively. In the Agency Automobile line
of business, active policies at December 31, 2011 were level with the same date in 2010. Active policies
in the Agency Homeowners and Other line of business at December 31, 2011 grew by 1% over the
same date in 2010.
91