Travelers 2011 Annual Report Download - page 87
Download and view the complete annual report
Please find page 87 of the 2011 Travelers annual report below. You can navigate through the pages in the report by either clicking on the pages listed below, or by using the keyword search tool below to find specific information within the annual report.-
 1
1 -
2
-
3
-
4
-
5
-
6
-
7
-
8
-
9
-
10
-
11
-
12
-
13
-
14
-
15
-
16
-
17
-
18
-
19
-
20
-
21
-
22
-
23
-
24
-
25
-
26
-
27
-
28
-
29
-
30
-
31
-
32
-
33
-
34
-
35
-
36
-
37
-
38
-
39
-
40
-
41
-
42
-
43
-
44
-
45
-
46
-
47
-
48
-
49
-
50
-
51
-
52
-
53
-
54
-
55
-
56
-
57
-
58
-
59
-
60
-
61
-
62
-
63
-
64
-
65
-
66
-
67
-
68
-
69
-
70
-
71
-
72
-
73
-
74
-
75
-
76
-
 77
77 -
 78
78 -
 79
79 -
 80
80 -
 81
81 -
 82
82 -
 83
83 -
 84
84 -
 85
85 -
 86
86 -
 87
87 -
 88
88 -
 89
89 -
 90
90 -
 91
91 -
 92
92 -
 93
93 -
 94
94 -
 95
95 -
 96
96 -
 97
97 -
98
-
99
-
100
-
101
-
102
-
103
-
104
-
105
-
106
-
107
-
108
-
109
-
110
-
111
-
112
-
113
-
114
-
115
-
116
-
117
-
118
-
119
-
120
-
121
-
122
-
123
-
124
-
125
-
126
-
127
-
128
-
129
-
130
-
131
-
132
-
133
-
134
-
135
-
136
-
137
-
138
-
139
-
140
-
141
-
142
-
143
-
144
-
145
-
146
-
147
-
148
-
149
-
150
-
151
-
152
-
153
-
154
-
155
-
156
-
157
-
158
-
159
-
160
-
161
-
162
-
163
-
164
-
165
-
166
-
167
-
168
-
169
-
170
-
171
-
172
-
173
-
174
-
175
-
176
-
177
-
178
-
179
-
180
-
181
-
182
-
183
-
184
-
185
-
186
-
187
-
188
-
189
-
190
-
191
-
192
-
193
-
194
-
195
-
196
-
197
-
198
-
199
-
200
-
201
-
202
-
203
-
204
-
205
-
206
-
207
-
208
-
209
-
210
-
211
-
212
-
213
-
214
-
215
-
216
-
217
-
218
-
219
-
220
-
221
-
222
-
223
-
224
-
225
-
226
-
227
-
228
-
229
-
230
-
231
-
232
-
233
-
234
-
235
-
236
-
237
-
238
-
239
-
240
-
241
-
242
-
243
-
244
-
245
-
246
-
247
-
248
-
249
-
250
-
251
-
252
-
253
-
254
-
255
-
256
-
257
-
258
-
259
-
260
-
261
-
262
-
263
-
264
-
265
-
266
-
267
-
268
-
269
-
270
-
271
-
272
-
273
-
274
-
275
-
276
-
277
-
278
-
279
-
280
-
281
-
282
-
283
-
284
-
285
-
286
-
287
-
288
-
289
-
290
-
291
-
292
-
293
 |
 |
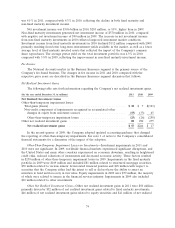
investment gains related to other investments, partially offset by net realized investment losses of
$62 million associated with U.S. Treasury futures contracts (which require daily mark-to-market
settlement and are used to shorten the duration of the Company’s fixed maturity investment portfolio).
Other net realized investment gains in 2010 were $290 million, including a $205 million pretax gain
resulting from the Company’s sale of substantially all of its remaining common stock holdings in Verisk
Analytics, Inc. (Verisk) for total proceeds of approximately $230 million as part of a secondary public
offering of Verisk. The 2010 total also included $96 million of net realized investment gains related to
fixed maturity investments and $25 million of net realized investment gains related to equity securities.
These gains were partially offset by $30 million of net realized investment losses related to U.S.
Treasury futures contracts.
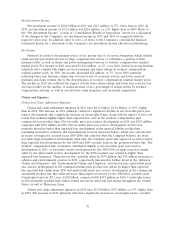
Other net realized investment gains in 2009 were $275 million. In October 2009, the Company sold
a portion of its common stock holdings in Verisk for total proceeds of approximately $184 million as
part of the initial public offering of Verisk. The Company recorded a pretax realized investment gain of
$159 million on this sale in 2009. Other net realized investment gains in 2009 also included
$100 million of net realized investment gains related to fixed maturity investments, $23 million of net
realized investment gains associated with the U.S. Treasury futures contracts and $23 million of net
realized investment losses related to foreign exchange.
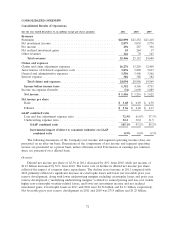
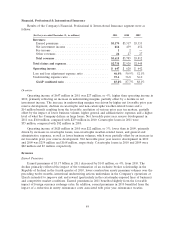
Other Revenues
Other revenues primarily consist of premium installment charges. In 2010, this category also
included $60 million of expenses related to the Company’s purchase and retirement of $885 million of
its $1.0 billion 6.25% fixed-to-floating rate junior subordinated debentures.
Claims and Expenses
Claims and Claim Adjustment Expenses
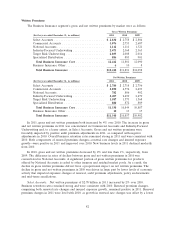
Claims and claim adjustment expenses in 2011 were $16.28 billion, $3.07 billion, or 23%, higher
than in 2010. The increase primarily reflected the significant increase in catastrophe losses, a decrease
in net favorable prior year reserve development, the impact of loss cost trends and higher
non-catastrophe weather-related losses. Catastrophe losses in 2011 and 2010 were $2.56 billion and
$1.11 billion, respectively. Catastrophe losses in 2011 primarily resulted from numerous tornadoes, wind
and hail storms and severe winter storms, as well as Hurricane Irene. Net favorable prior year reserve
development in 2011 and 2010 was $715 million and $1.25 billion, respectively. With respect to net
favorable prior year reserve development in 2011, accident years prior to and including 2009
experienced $1.10 billion of net favorable prior year reserve development, while the 2010 accident year
experienced $383 million of net unfavorable prior year reserve development. Factors contributing to net
favorable prior year reserve development are discussed in more detail in the segment discussions that
follow.
Claims and claim adjustment expenses were $13.21 billion in 2010, $802 million, or 6%, higher
than in 2009. The increase primarily reflected the significant increase in catastrophe losses, the modest
decline in net favorable prior year reserve development and the impact of loss cost trends. Catastrophe
losses in 2010 and 2009 were $1.11 billion and $457 million, respectively. Catastrophe losses in 2010
primarily resulted from several severe wind and hail storms, as well as severe winter storms and an
earthquake in Chile. Catastrophe losses in 2009 primarily resulted from several wind and hail storms, as
well as flooding. Net favorable prior year reserve development in 2010 and 2009 were $1.25 billion and
$1.33 billion, respectively.
75