Travelers 2011 Annual Report Download - page 115
Download and view the complete annual report
Please find page 115 of the 2011 Travelers annual report below. You can navigate through the pages in the report by either clicking on the pages listed below, or by using the keyword search tool below to find specific information within the annual report.-
 1
1 -
2
-
3
-
4
-
5
-
6
-
7
-
8
-
9
-
10
-
11
-
12
-
13
-
14
-
15
-
16
-
17
-
18
-
19
-
20
-
21
-
22
-
23
-
24
-
25
-
26
-
27
-
28
-
29
-
30
-
31
-
32
-
33
-
34
-
35
-
36
-
37
-
38
-
39
-
40
-
41
-
42
-
43
-
44
-
45
-
46
-
47
-
48
-
49
-
50
-
51
-
52
-
53
-
54
-
55
-
56
-
57
-
58
-
59
-
60
-
61
-
62
-
63
-
64
-
65
-
66
-
67
-
68
-
69
-
70
-
71
-
72
-
73
-
74
-
75
-
76
-
77
-
78
-
79
-
80
-
81
-
82
-
83
-
84
-
85
-
86
-
87
-
88
-
89
-
90
-
91
-
92
-
93
-
94
-
95
-
96
-
97
-
98
-
99
-
100
-
101
-
102
-
103
-
104
-
 105
105 -
 106
106 -
 107
107 -
 108
108 -
 109
109 -
 110
110 -
 111
111 -
 112
112 -
 113
113 -
 114
114 -
 115
115 -
 116
116 -
 117
117 -
 118
118 -
 119
119 -
 120
120 -
 121
121 -
 122
122 -
 123
123 -
 124
124 -
 125
125 -
126
-
127
-
128
-
129
-
130
-
131
-
132
-
133
-
134
-
135
-
136
-
137
-
138
-
139
-
140
-
141
-
142
-
143
-
144
-
145
-
146
-
147
-
148
-
149
-
150
-
151
-
152
-
153
-
154
-
155
-
156
-
157
-
158
-
159
-
160
-
161
-
162
-
163
-
164
-
165
-
166
-
167
-
168
-
169
-
170
-
171
-
172
-
173
-
174
-
175
-
176
-
177
-
178
-
179
-
180
-
181
-
182
-
183
-
184
-
185
-
186
-
187
-
188
-
189
-
190
-
191
-
192
-
193
-
194
-
195
-
196
-
197
-
198
-
199
-
200
-
201
-
202
-
203
-
204
-
205
-
206
-
207
-
208
-
209
-
210
-
211
-
212
-
213
-
214
-
215
-
216
-
217
-
218
-
219
-
220
-
221
-
222
-
223
-
224
-
225
-
226
-
227
-
228
-
229
-
230
-
231
-
232
-
233
-
234
-
235
-
236
-
237
-
238
-
239
-
240
-
241
-
242
-
243
-
244
-
245
-
246
-
247
-
248
-
249
-
250
-
251
-
252
-
253
-
254
-
255
-
256
-
257
-
258
-
259
-
260
-
261
-
262
-
263
-
264
-
265
-
266
-
267
-
268
-
269
-
270
-
271
-
272
-
273
-
274
-
275
-
276
-
277
-
278
-
279
-
280
-
281
-
282
-
283
-
284
-
285
-
286
-
287
-
288
-
289
-
290
-
291
-
292
-
293
 |
 |

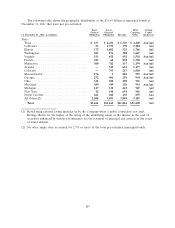
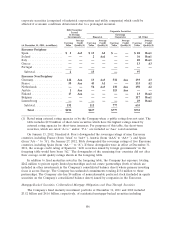
The following table shows the geographic distribution of the $31.69 billion of municipal bonds at
December 31, 2011 that were not pre-refunded.
State Local Total Average
General General Carrying Credit
(at December 31, 2011, in millions) Obligation Obligation Revenue Value Quality(1)
State:
Texas ............................... $ 437 $ 2,454 $ 1,349 $ 4,240 Aaa/Aa1
California ............................ 55 1,759 370 2,184 Aa2
Illinois .............................. 175 1,002 529 1,706 Aa1
Washington ........................... 403 876 388 1,667 Aa1
Virginia ............................. 193 658 692 1,543 Aaa/Aa1
Florida .............................. 422 68 838 1,328 Aa1
Minnesota ........................... 300 762 137 1,199 Aaa/Aa1
Arizona ............................. — 543 634 1,177 Aa1
Colorado ............................ — 793 217 1,010 Aa1
Massachusetts ......................... 176 9 810 995 Aaa/Aa1
Georgia ............................. 252 401 291 944 Aaa/Aa1
Ohio ............................... 331 302 298 931 Aa1
Maryland ............................ 309 449 156 914 Aaa/Aa1
Michigan ............................ 127 338 442 907 Aa2
New York ............................ 12 198 691 901 Aa1
North Carolina ........................ 261 460 138 859 Aaa
All Others(2) ......................... 2,208 3,093 3,884 9,185 Aa1
Total .............................. $5,661 $14,165 $11,864 $31,690 Aa1
(1) Rated using external rating agencies or by the Company when a public rating does not exist.
Ratings shown are the higher of the rating of the underlying issuer or the insurer in the case of
securities enhanced by third-party insurance for the payment of principal and interest in the event
of issuer default.
(2) No other single state accounted for 2.5% or more of the total pre-refunded municipal bonds.
103