Travelers 2011 Annual Report Download - page 215
Download and view the complete annual report
Please find page 215 of the 2011 Travelers annual report below. You can navigate through the pages in the report by either clicking on the pages listed below, or by using the keyword search tool below to find specific information within the annual report.-
 1
1 -
2
-
3
-
4
-
5
-
6
-
7
-
8
-
9
-
10
-
11
-
12
-
13
-
14
-
15
-
16
-
17
-
18
-
19
-
20
-
21
-
22
-
23
-
24
-
25
-
26
-
27
-
28
-
29
-
30
-
31
-
32
-
33
-
34
-
35
-
36
-
37
-
38
-
39
-
40
-
41
-
42
-
43
-
44
-
45
-
46
-
47
-
48
-
49
-
50
-
51
-
52
-
53
-
54
-
55
-
56
-
57
-
58
-
59
-
60
-
61
-
62
-
63
-
64
-
65
-
66
-
67
-
68
-
69
-
70
-
71
-
72
-
73
-
74
-
75
-
76
-
77
-
78
-
79
-
80
-
81
-
82
-
83
-
84
-
85
-
86
-
87
-
88
-
89
-
90
-
91
-
92
-
93
-
94
-
95
-
96
-
97
-
98
-
99
-
100
-
101
-
102
-
103
-
104
-
105
-
106
-
107
-
108
-
109
-
110
-
111
-
112
-
113
-
114
-
115
-
116
-
117
-
118
-
119
-
120
-
121
-
122
-
123
-
124
-
125
-
126
-
127
-
128
-
129
-
130
-
131
-
132
-
133
-
134
-
135
-
136
-
137
-
138
-
139
-
140
-
141
-
142
-
143
-
144
-
145
-
146
-
147
-
148
-
149
-
150
-
151
-
152
-
153
-
154
-
155
-
156
-
157
-
158
-
159
-
160
-
161
-
162
-
163
-
164
-
165
-
166
-
167
-
168
-
169
-
170
-
171
-
172
-
173
-
174
-
175
-
176
-
177
-
178
-
179
-
180
-
181
-
182
-
183
-
184
-
185
-
186
-
187
-
188
-
189
-
190
-
191
-
192
-
193
-
194
-
195
-
196
-
197
-
198
-
199
-
200
-
201
-
202
-
203
-
204
-
 205
205 -
 206
206 -
 207
207 -
 208
208 -
 209
209 -
 210
210 -
 211
211 -
 212
212 -
 213
213 -
 214
214 -
 215
215 -
 216
216 -
 217
217 -
 218
218 -
 219
219 -
 220
220 -
 221
221 -
 222
222 -
 223
223 -
 224
224 -
 225
225 -
226
-
227
-
228
-
229
-
230
-
231
-
232
-
233
-
234
-
235
-
236
-
237
-
238
-
239
-
240
-
241
-
242
-
243
-
244
-
245
-
246
-
247
-
248
-
249
-
250
-
251
-
252
-
253
-
254
-
255
-
256
-
257
-
258
-
259
-
260
-
261
-
262
-
263
-
264
-
265
-
266
-
267
-
268
-
269
-
270
-
271
-
272
-
273
-
274
-
275
-
276
-
277
-
278
-
279
-
280
-
281
-
282
-
283
-
284
-
285
-
286
-
287
-
288
-
289
-
290
-
291
-
292
-
293
 |
 |
THE TRAVELERS COMPANIES, INC. AND SUBSIDIARIES
NOTES TO CONSOLIDATED FINANCIAL STATEMENTS (Continued)
7. INSURANCE CLAIM RESERVES (Continued)
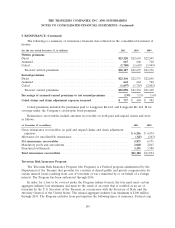
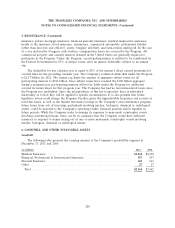
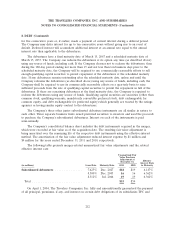
Gross claims and claim adjustment expense reserves at December 31, 2011 and 2010 decreased by
$184 million and $1.99 billion from the respective prior year-end, primarily reflecting ongoing claims
and claim adjustment expense activity, including losses incurred and payments made, as well as net
favorable prior year reserve development and payments related to operations in runoff, partially offset
by the significant catastrophe losses incurred in 2011 and growth in business volume.
The $848 million decline in reinsurance recoverables at December 31, 2011 compared with the
prior year reflected cash collections and the impact of net favorable prior year reserve development.
The $1.31 billion decline in reinsurance recoverables at December 31, 2010 compared with the prior
year-end primarily reflected cash collections and the impact of net favorable prior year reserve
development, partially offset by a reduction in the allowance for uncollectible reinsurance.
Prior Year Reserve Development
The following disclosures regarding reserve development are on a ‘‘net of reinsurance’’ basis.
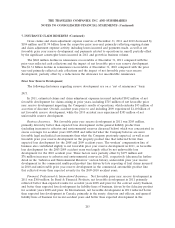
2011.
In 2011, estimated claims and claim adjustment expenses incurred included $842 million of net
favorable development for claims arising in prior years, including $715 million of net favorable prior
year reserve development impacting the Company’s results of operations, which excludes $45 million of
accretion of discount. Overall, accident years prior to and including 2009 experienced $1.10 billion of
net favorable reserve development, while the 2010 accident year experienced $383 million of net
unfavorable reserve development.
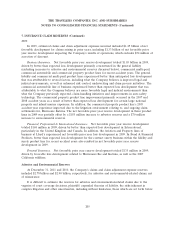
Business Insurance. Net favorable prior year reserve development in 2011 was $245 million,
primarily driven by better than expected loss development in the general liability product line
(excluding increases to asbestos and environmental reserves discussed below) which was concentrated in
excess coverages for accident years 2005-2008 and reflected what the Company believes are more
favorable legal and judicial environments than what the Company previously expected, as well as net
favorable prior year reserve development in the property product line that reflected better than
expected loss development for the 2008 and 2009 accident years. The workers’ compensation line of
business also contributed slightly to net favorable prior year reserve development in 2011, as favorable
loss development for the 2003-2009 accident years was largely offset by net unfavorable loss
development for the 2010 accident year. These factors were partially offset by $175 million and
$76 million increases to asbestos and environmental reserves in 2011, respectively (discussed in further
detail in the ‘‘Asbestos and Environmental Reserves’’ section below), unfavorable prior year reserve
development in the commercial multi-peril product line driven by late reporting of hail claims incurred
in 2010 and unfavorable prior year reserve development in the commercial automobile product line
that reflected worse than expected severity for the 2009-2010 accident years.
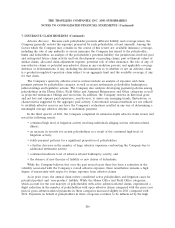
Financial, Professional & International Insurance. Net favorable prior year reserve development in
2011 was $360 million. In Bond & Financial Products, net favorable development in 2011 primarily
reflected better than expected results for accident years 2008 and prior for the contract surety business,
and better than expected loss development for liability lines of business, driven by the fiduciary product
for accident years 2008 and prior. In International, net favorable development in 2011 reflected better
than expected loss development in Canada, primarily in the surety, directors and officers, and general
liability lines of business for recent accident years and better than expected development in the
203