Travelers 2011 Annual Report Download - page 40
Download and view the complete annual report
Please find page 40 of the 2011 Travelers annual report below. You can navigate through the pages in the report by either clicking on the pages listed below, or by using the keyword search tool below to find specific information within the annual report.-
 1
1 -
2
-
3
-
4
-
5
-
6
-
7
-
8
-
9
-
10
-
11
-
12
-
13
-
14
-
15
-
16
-
17
-
18
-
19
-
20
-
21
-
22
-
23
-
24
-
25
-
26
-
27
-
28
-
29
-
 30
30 -
 31
31 -
 32
32 -
 33
33 -
 34
34 -
 35
35 -
 36
36 -
 37
37 -
 38
38 -
 39
39 -
 40
40 -
 41
41 -
 42
42 -
 43
43 -
 44
44 -
 45
45 -
 46
46 -
 47
47 -
 48
48 -
 49
49 -
 50
50 -
51
-
52
-
53
-
54
-
55
-
56
-
57
-
58
-
59
-
60
-
61
-
62
-
63
-
64
-
65
-
66
-
67
-
68
-
69
-
70
-
71
-
72
-
73
-
74
-
75
-
76
-
77
-
78
-
79
-
80
-
81
-
82
-
83
-
84
-
85
-
86
-
87
-
88
-
89
-
90
-
91
-
92
-
93
-
94
-
95
-
96
-
97
-
98
-
99
-
100
-
101
-
102
-
103
-
104
-
105
-
106
-
107
-
108
-
109
-
110
-
111
-
112
-
113
-
114
-
115
-
116
-
117
-
118
-
119
-
120
-
121
-
122
-
123
-
124
-
125
-
126
-
127
-
128
-
129
-
130
-
131
-
132
-
133
-
134
-
135
-
136
-
137
-
138
-
139
-
140
-
141
-
142
-
143
-
144
-
145
-
146
-
147
-
148
-
149
-
150
-
151
-
152
-
153
-
154
-
155
-
156
-
157
-
158
-
159
-
160
-
161
-
162
-
163
-
164
-
165
-
166
-
167
-
168
-
169
-
170
-
171
-
172
-
173
-
174
-
175
-
176
-
177
-
178
-
179
-
180
-
181
-
182
-
183
-
184
-
185
-
186
-
187
-
188
-
189
-
190
-
191
-
192
-
193
-
194
-
195
-
196
-
197
-
198
-
199
-
200
-
201
-
202
-
203
-
204
-
205
-
206
-
207
-
208
-
209
-
210
-
211
-
212
-
213
-
214
-
215
-
216
-
217
-
218
-
219
-
220
-
221
-
222
-
223
-
224
-
225
-
226
-
227
-
228
-
229
-
230
-
231
-
232
-
233
-
234
-
235
-
236
-
237
-
238
-
239
-
240
-
241
-
242
-
243
-
244
-
245
-
246
-
247
-
248
-
249
-
250
-
251
-
252
-
253
-
254
-
255
-
256
-
257
-
258
-
259
-
260
-
261
-
262
-
263
-
264
-
265
-
266
-
267
-
268
-
269
-
270
-
271
-
272
-
273
-
274
-
275
-
276
-
277
-
278
-
279
-
280
-
281
-
282
-
283
-
284
-
285
-
286
-
287
-
288
-
289
-
290
-
291
-
292
-
293
 |
 |
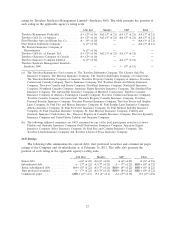
Rating Agency Actions
The following rating agency actions were taken with respect to the Company from February 17,
2011 (the date on which the Company filed its Form 10-K for the year ended December 31, 2010),
through February 16, 2012:
• On May 26, 2011, A.M. Best affirmed the Company’s debt ratings for The Travelers
Companies, Inc. and reaffirmed the claims-paying ratings for the Travelers Reinsurance Pool,
Travelers C&S Co. of America, First Floridian Auto and Home Ins. Co., First Trenton Indemnity
Company, The Premier Insurance Company of Massachusetts, Travelers C&S Co. of Europe Ltd.
and Travelers Guarantee Company of Canada. The outlook for all ratings is stable.
• On July 28, 2011, S&P upgraded the claims-paying ratings for the Travelers Reinsurance Pool,
Travelers C&S Co. of America, Travelers C&S Co. of Europe Ltd. and Travelers Insurance
Company Limited to ‘‘AA.’’ In addition, the ratings for the Company’s senior debt, subordinated
debt, junior subordinated debt, trust preferred securities and commercial paper were each
upgraded one notch. The outlook for all ratings is stable.
• On September 8, 2011, Fitch affirmed all ratings of the Company. The outlook for all ratings is
stable.
• On October 25, 2011, A.M. Best affirmed the financial strength and issuer credit ratings of
Travelers Insurance Company Limited. The outlook for both ratings is stable.
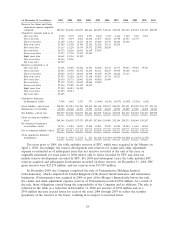
INVESTMENT OPERATIONS
The majority of funds available for investment are deployed in a widely diversified portfolio of
high quality, liquid taxable U.S. government, tax-exempt U.S. municipal and taxable corporate and U.S.
agency mortgage-backed bonds. The Company closely monitors the duration of its fixed maturity
investments, and the Company’s investment purchases and sales are executed with the objective of
having adequate funds available to satisfy its insurance and debt obligations. Generally, the expected
principal and interest payments produced by the Company’s fixed maturity portfolio adequately fund
the estimated runoff of the Company’s insurance reserves. The Company’s management of the duration
of the fixed maturity investment portfolio has historically produced a duration that exceeds the
estimated duration of the Company’s net insurance liabilities. Recently, the estimated average effective
duration of the Company’s portfolio of fixed maturity and short-term security investments has declined,
primarily due to the impact of declining market yields and tightening investment spreads on existing
holdings of mortgage-backed securities (both of which impact the assumptions related to optional
pre-payments), an increase in pre-refunded municipal bonds and general portfolio management
decisions. The Company has also recently experienced an increase in the estimated average effective
duration of its net insurance liabilities, primarily reflecting the impact of declining market interest rates,
as well as an increase in workers’ compensation insurance business volume. As a result, the estimated
average effective duration of the Company’s net insurance liabilities exceeded that of its portfolio of
fixed maturity and short-term security investments at December 31, 2011. The substantial amount by
which the fair value of the fixed maturity portfolio exceeds the expected present value of the net
insurance liabilities, as well as the positive cash flow from newly sold policies and the large amount of
high quality liquid bonds, contributes to the Company’s ability to fund claim payments without having
to sell illiquid assets or access credit facilities.
The Company also invests much smaller amounts in equity securities, real estate, private equity
limited partnerships, hedge funds, real estate partnerships, real estate and insurance joint ventures,
mortgage loans, venture capital (through direct ownership and limited partnerships) and trading
securities. These investment classes have the potential for higher returns but also involve varying
degrees of risk, including less stable rates of return and less liquidity.
See note 3 of notes to the Company’s consolidated financial statements for additional information
regarding the Company’s investment portfolio.
28