Travelers 2011 Annual Report Download - page 123
Download and view the complete annual report
Please find page 123 of the 2011 Travelers annual report below. You can navigate through the pages in the report by either clicking on the pages listed below, or by using the keyword search tool below to find specific information within the annual report.-
 1
1 -
2
-
3
-
4
-
5
-
6
-
7
-
8
-
9
-
10
-
11
-
12
-
13
-
14
-
15
-
16
-
17
-
18
-
19
-
20
-
21
-
22
-
23
-
24
-
25
-
26
-
27
-
28
-
29
-
30
-
31
-
32
-
33
-
34
-
35
-
36
-
37
-
38
-
39
-
40
-
41
-
42
-
43
-
44
-
45
-
46
-
47
-
48
-
49
-
50
-
51
-
52
-
53
-
54
-
55
-
56
-
57
-
58
-
59
-
60
-
61
-
62
-
63
-
64
-
65
-
66
-
67
-
68
-
69
-
70
-
71
-
72
-
73
-
74
-
75
-
76
-
77
-
78
-
79
-
80
-
81
-
82
-
83
-
84
-
85
-
86
-
87
-
88
-
89
-
90
-
91
-
92
-
93
-
94
-
95
-
96
-
97
-
98
-
99
-
100
-
101
-
102
-
103
-
104
-
105
-
106
-
107
-
108
-
109
-
110
-
111
-
112
-
 113
113 -
 114
114 -
 115
115 -
 116
116 -
 117
117 -
 118
118 -
 119
119 -
 120
120 -
 121
121 -
 122
122 -
 123
123 -
 124
124 -
 125
125 -
 126
126 -
 127
127 -
 128
128 -
 129
129 -
 130
130 -
 131
131 -
 132
132 -
 133
133 -
134
-
135
-
136
-
137
-
138
-
139
-
140
-
141
-
142
-
143
-
144
-
145
-
146
-
147
-
148
-
149
-
150
-
151
-
152
-
153
-
154
-
155
-
156
-
157
-
158
-
159
-
160
-
161
-
162
-
163
-
164
-
165
-
166
-
167
-
168
-
169
-
170
-
171
-
172
-
173
-
174
-
175
-
176
-
177
-
178
-
179
-
180
-
181
-
182
-
183
-
184
-
185
-
186
-
187
-
188
-
189
-
190
-
191
-
192
-
193
-
194
-
195
-
196
-
197
-
198
-
199
-
200
-
201
-
202
-
203
-
204
-
205
-
206
-
207
-
208
-
209
-
210
-
211
-
212
-
213
-
214
-
215
-
216
-
217
-
218
-
219
-
220
-
221
-
222
-
223
-
224
-
225
-
226
-
227
-
228
-
229
-
230
-
231
-
232
-
233
-
234
-
235
-
236
-
237
-
238
-
239
-
240
-
241
-
242
-
243
-
244
-
245
-
246
-
247
-
248
-
249
-
250
-
251
-
252
-
253
-
254
-
255
-
256
-
257
-
258
-
259
-
260
-
261
-
262
-
263
-
264
-
265
-
266
-
267
-
268
-
269
-
270
-
271
-
272
-
273
-
274
-
275
-
276
-
277
-
278
-
279
-
280
-
281
-
282
-
283
-
284
-
285
-
286
-
287
-
288
-
289
-
290
-
291
-
292
-
293
 |
 |

catastrophe exposure. Accordingly, catastrophe estimates provided by different insurers may not be
comparable.
During the first quarter of 2011, a new version of a third-party proprietary computer model
utilized by the Company, as well as others in the insurance industry, to estimate potential aggregate
hurricane losses was released. After evaluating multiple third-party models and calibrating its own
historical loss experience and underwriting practices, the Company increased its estimated modeled
loss, using its own proprietary modeling processes, from a single U.S. hurricane by a range of 10% to
24%. For each modeled event, the percentage magnitude of the loss increase within this range will vary
based on this evaluation.
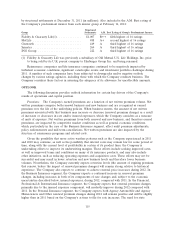
The tables below set forth the probabilities that estimated losses from a single event occurring in a
one-year timeframe will equal or exceed the indicated loss amounts (expressed in dollars and as a
percentage of the Company’s common equity), based on the current version of the proprietary
computer model utilized by the Company at December 31, 2011. For example, on the basis described
below the tables, the Company estimates that there is a one percent chance that the Company’s loss
from a single U.S. hurricane in a one-year timeframe would equal or exceed $1.4 billion, or 6% of the
Company’s common equity at December 31, 2011.
Dollars (in billions)
Single U.S.
Single U.S. and Canadian
Likelihood of Exceedance(1) Hurricane Earthquake
2.0% (1-in-50) ................................. $1.0 $0.5
1.0% (1-in-100) ................................. $1.4 $0.6
0.4% (1-in-250) ................................. $2.4 $0.9
0.1% (1-in-1,000) ............................... $5.4 $2.0
Percentage of
Common Equity(2)
Single U.S.
Single U.S. and Canadian
Likelihood of Exceedance Hurricane Earthquake
2.0% (1-in-50) ................................. 5% 2%
1.0% (1-in-100) ................................. 6% 3%
0.4% (1-in-250) ................................. 11% 4%
0.1% (1-in-1,000) ............................... 25% 9%
(1) An event that has, for example, a 2% likelihood of exceedance is sometimes described as
a ‘‘1-in-50 year event.’’ As noted above, however, the probabilities in the table represent
the likelihood of losses from a single event equaling or exceeding the indicated threshold
loss amount in a one-year timeframe, not over a multi-year timeframe. Also, because the
probabilities relate to a single event, the probabilities do not address the likelihood of
more than one event occurring in a particular period, and, therefore, the amounts do not
address potential aggregate catastrophe losses occurring in a one-year timeframe.
(2) The percentage of common equity is calculated by dividing (a) indicated loss amounts in
dollars by (b) total common equity excluding net unrealized investment gains and losses,
net of taxes. Net unrealized investment gains and losses can be significantly impacted by
both discretionary and other economic factors and are not necessarily indicative of
operating trends. Accordingly, the Company’s management uses the percentage of
common equity calculated on this basis as a metric to evaluate the potential impact of a
single hurricane or single earthquake on the Company’s financial position for purposes of
making underwriting and reinsurance decisions.
111