Sallie Mae 2014 Annual Report Download - page 91
Download and view the complete annual report
Please find page 91 of the 2014 Sallie Mae annual report below. You can navigate through the pages in the report by either clicking on the pages listed below, or by using the keyword search tool below to find specific information within the annual report.-
 1
1 -
2
-
3
-
4
-
5
-
6
-
7
-
8
-
9
-
10
-
11
-
12
-
13
-
14
-
15
-
16
-
17
-
18
-
19
-
20
-
21
-
22
-
23
-
24
-
25
-
26
-
27
-
28
-
29
-
30
-
31
-
32
-
33
-
34
-
35
-
36
-
37
-
38
-
39
-
40
-
41
-
42
-
43
-
44
-
45
-
46
-
47
-
48
-
49
-
50
-
51
-
52
-
53
-
54
-
55
-
56
-
57
-
58
-
59
-
60
-
61
-
62
-
63
-
64
-
65
-
66
-
67
-
68
-
69
-
70
-
71
-
72
-
73
-
74
-
75
-
76
-
77
-
78
-
79
-
80
-
 81
81 -
 82
82 -
 83
83 -
 84
84 -
 85
85 -
 86
86 -
 87
87 -
 88
88 -
 89
89 -
 90
90 -
 91
91 -
 92
92 -
 93
93 -
 94
94 -
 95
95 -
 96
96 -
 97
97 -
 98
98 -
 99
99 -
 100
100 -
 101
101 -
102
-
103
-
104
-
105
-
106
-
107
-
108
-
109
-
110
-
111
-
112
-
113
-
114
-
115
-
116
-
117
-
118
-
119
-
120
-
121
-
122
-
123
-
124
-
125
-
126
-
127
-
128
-
129
-
130
-
131
-
132
-
133
-
134
-
135
-
136
-
137
-
138
-
139
-
140
-
141
-
142
-
143
-
144
-
145
-
146
 |
 |

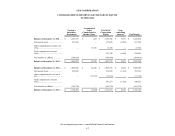
SLM CORPORATION
CONSOLIDATED STATEMENTS OF CHANGES IN EQUITY
(In thousands)
Navient's
Subsidiary
Investment
Accumulated
Other
Comprehensive
Income (Loss)
Total SLM
Corporation
Equity
Non-
controlling
Interest
Total Equity
Balance at December 31, 2011 .....
$
1,235,318
$
622
$
1,235,940
$
7,918
$
1,243,858
Net income (loss) .........................
217,620
—
217,620
(1,894
)
215,726
Other comprehensive income, net
of tax ..........................................
—
13,726
13,726
—
13,726
Total comprehensive income
(loss) ..........................................
231,346
(1,894
)
229,452
Net transfers to affiliate ................
(384,010
)
—
(384,010
)
—
(384,010
)
Balance at December 31, 2012 .....
$
1,068,928
$
14,348
$
1,083,276
$
6,024
$
1,089,300
Balance at December 31, 2012 .....
$
1,068,928
$
14,348
$
1,083,276
$
6,024
$
1,089,300
Net income (loss) .........................
258,945
—
258,945
(1,352
)
257,593
Other comprehensive loss, net of
tax ..............................................
—
(17,372
)
(17,372
)
—
(17,372
)
Total comprehensive income
(loss) ..........................................
241,573
(1,352
)
240,221
Net transfers to affiliate ................
(163,378
)
—
(163,378
)
—
(163,378
)
Balance at December 31, 2013 .....
$
1,164,495
$
(3,024
)
$
1,161,471
$
4,672
$
1,166,143
See accompanying notes to consolidated financial statements.
F-7