Sallie Mae 2014 Annual Report Download - page 34
Download and view the complete annual report
Please find page 34 of the 2014 Sallie Mae annual report below. You can navigate through the pages in the report by either clicking on the pages listed below, or by using the keyword search tool below to find specific information within the annual report.-
 1
1 -
2
-
3
-
4
-
5
-
6
-
7
-
8
-
9
-
10
-
11
-
12
-
13
-
14
-
15
-
16
-
17
-
18
-
19
-
20
-
21
-
22
-
23
-
 24
24 -
 25
25 -
 26
26 -
 27
27 -
 28
28 -
 29
29 -
 30
30 -
 31
31 -
 32
32 -
 33
33 -
 34
34 -
 35
35 -
 36
36 -
 37
37 -
 38
38 -
 39
39 -
 40
40 -
 41
41 -
 42
42 -
 43
43 -
 44
44 -
45
-
46
-
47
-
48
-
49
-
50
-
51
-
52
-
53
-
54
-
55
-
56
-
57
-
58
-
59
-
60
-
61
-
62
-
63
-
64
-
65
-
66
-
67
-
68
-
69
-
70
-
71
-
72
-
73
-
74
-
75
-
76
-
77
-
78
-
79
-
80
-
81
-
82
-
83
-
84
-
85
-
86
-
87
-
88
-
89
-
90
-
91
-
92
-
93
-
94
-
95
-
96
-
97
-
98
-
99
-
100
-
101
-
102
-
103
-
104
-
105
-
106
-
107
-
108
-
109
-
110
-
111
-
112
-
113
-
114
-
115
-
116
-
117
-
118
-
119
-
120
-
121
-
122
-
123
-
124
-
125
-
126
-
127
-
128
-
129
-
130
-
131
-
132
-
133
-
134
-
135
-
136
-
137
-
138
-
139
-
140
-
141
-
142
-
143
-
144
-
145
-
146
 |
 |

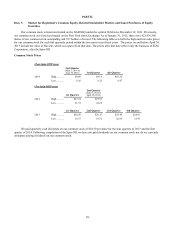
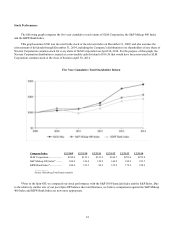
Stock Performance
The following graph compares the five-year cumulative total returns of SLM Corporation, the S&P Midcap 400 Index
and the KBW Bank Index.
This graph assumes $100 was invested in the stock or the relevant index on December 31, 2009, and also assumes the
reinvestment of dividends through December 31, 2014, including the Company’s distribution to its shareholders of one share of
Navient Corporation common stock for every share of SLM Corporation on April 30, 2014. For the purpose of this graph, the
Navient Corporation distribution is treated as a non-taxable cash dividend of $16.56 that would have been reinvested in SLM
Corporation common stock at the close of business April 30, 2014.
Five Year Cumulative Total Stockholder Return
Company/Index
12/31/09
12/31/10
12/31/11
12/31/12
12/31/13
12/31/14
SLM Corporation ...................
$100.0
$112.1
$121.9
$160.7
$253.0
$279.8
S&P Midcap 400 Index* ........
100.0
126.4
124.2
146.2
194.9
213.7
KBW Bank Index*.................
100.0
123.3
94.9
125.8
172.9
188.9
_________
Source: Bloomberg Total Return Analysis
*Prior to the Spin-Off, we compared our stock performance with the S&P 500 Financials Index and the S&P Index. Due
to the relatively smaller size of our post-Spin-Off balance sheet and business, we believe comparisons against the S&P Midcap
400 Index and KBW Bank Index are now more appropriate.
32