Sallie Mae 2014 Annual Report Download - page 131
Download and view the complete annual report
Please find page 131 of the 2014 Sallie Mae annual report below. You can navigate through the pages in the report by either clicking on the pages listed below, or by using the keyword search tool below to find specific information within the annual report.-
 1
1 -
2
-
3
-
4
-
5
-
6
-
7
-
8
-
9
-
10
-
11
-
12
-
13
-
14
-
15
-
16
-
17
-
18
-
19
-
20
-
21
-
22
-
23
-
24
-
25
-
26
-
27
-
28
-
29
-
30
-
31
-
32
-
33
-
34
-
35
-
36
-
37
-
38
-
39
-
40
-
41
-
42
-
43
-
44
-
45
-
46
-
47
-
48
-
49
-
50
-
51
-
52
-
53
-
54
-
55
-
56
-
57
-
58
-
59
-
60
-
61
-
62
-
63
-
64
-
65
-
66
-
67
-
68
-
69
-
70
-
71
-
72
-
73
-
74
-
75
-
76
-
77
-
78
-
79
-
80
-
81
-
82
-
83
-
84
-
85
-
86
-
87
-
88
-
89
-
90
-
91
-
92
-
93
-
94
-
95
-
96
-
97
-
98
-
99
-
100
-
101
-
102
-
103
-
104
-
105
-
106
-
107
-
108
-
109
-
110
-
111
-
112
-
113
-
114
-
115
-
116
-
117
-
118
-
119
-
120
-
 121
121 -
 122
122 -
 123
123 -
 124
124 -
 125
125 -
 126
126 -
 127
127 -
 128
128 -
 129
129 -
 130
130 -
 131
131 -
 132
132 -
 133
133 -
 134
134 -
 135
135 -
 136
136 -
 137
137 -
 138
138 -
 139
139 -
 140
140 -
 141
141 -
142
-
143
-
144
-
145
-
146
 |
 |

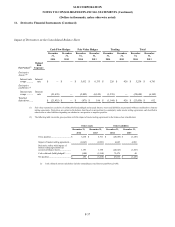
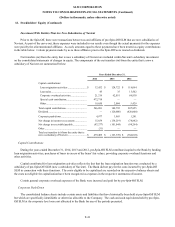
SLM CORPORATION
NOTES TO CONSOLIDATED FINANCIAL STATEMENTS (Continued)
(Dollars in thousands, unless otherwise noted)
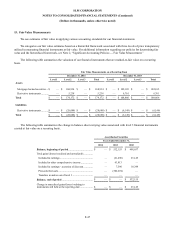
15. Fair Value Measurements
We use estimates of fair value in applying various accounting standards for our financial statements.
We categorize our fair value estimates based on a hierarchal framework associated with three levels of price transparency
utilized in measuring financial instruments at fair value. For additional information regarding our policies for determining fair
value and the hierarchical framework, see Note 2, “Significant Accounting Policies — Fair Value Measurement.”
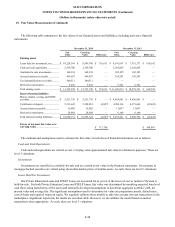
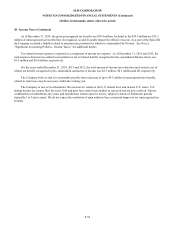
The following table summarizes the valuation of our financial instruments that are marked-to-fair value on a recurring
basis.
Fair Va l ue Measurements on a Recurring Basis
December 31, 2014
December 31, 2013
Level 1
Level 2
Level 3
Total
Level 1
Level 2
Level 3
Total
Assets
Mortgage-backed securities ....
$
—
$
168,934
$
—
$
168,934
$
—
$
102,105
$
—
$
102,105
Derivative instruments ...........
—
5,238
—
5,238
—
6,761
—
6,761
Total
$
—
$
174,172
$
—
$
174,172
$
—
$
108,866
$
—
$
108,866
Liabilities
Derivative instruments ...........
$
—
$
(28,688
)
$
—
$
(28,688
)
$
—
$
(6,149
)
$
—
$
(6,149
)
Total
$
—
$
(28,688
)
$
—
$
(28,688
)
$
—
$
(6,149
)
$
—
$
(6,149
)
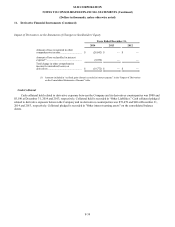
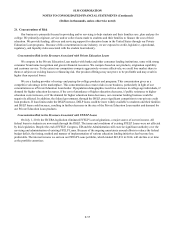
The following table summarizes the change in balance sheet carrying value associated with level 3 financial instruments
carried at fair value on a recurring basis.
Asset-Backed Securities
Years Ended December 31,
2014
2013
2012
Balance, beginning of period ..................................
$
—
$
532,155
$
498,657
Total gains/(losses) (realized and unrealized):.............
Included in earnings ..............................................
—
(21,490
)
23,149
Included in other comprehensive income .................
—
63,813
—
Included in earnings - accretion of discount .............
—
7,596
10,349
Proceeds from sale ................................................
—
(582,074
)
—
Transfers in and/or out of level 3 ............................
—
—
—
Balance, end of period ...........................................
$
—
$
—
$
532,155
Change in unrealized gains/(losses) relating to
instruments still held at the reporting date ..................
$
—
$
—
$
23,149
F-47