Sallie Mae 2014 Annual Report Download - page 10
Download and view the complete annual report
Please find page 10 of the 2014 Sallie Mae annual report below. You can navigate through the pages in the report by either clicking on the pages listed below, or by using the keyword search tool below to find specific information within the annual report.-
 1
1 -
 2
2 -
 3
3 -
 4
4 -
 5
5 -
 6
6 -
 7
7 -
 8
8 -
 9
9 -
 10
10 -
 11
11 -
 12
12 -
 13
13 -
 14
14 -
 15
15 -
 16
16 -
 17
17 -
 18
18 -
 19
19 -
 20
20 -
 21
21 -
22
-
23
-
24
-
25
-
26
-
27
-
28
-
29
-
30
-
31
-
32
-
33
-
34
-
35
-
36
-
37
-
38
-
39
-
40
-
41
-
42
-
43
-
44
-
45
-
46
-
47
-
48
-
49
-
50
-
51
-
52
-
53
-
54
-
55
-
56
-
57
-
58
-
59
-
60
-
61
-
62
-
63
-
64
-
65
-
66
-
67
-
68
-
69
-
70
-
71
-
72
-
73
-
74
-
75
-
76
-
77
-
78
-
79
-
80
-
81
-
82
-
83
-
84
-
85
-
86
-
87
-
88
-
89
-
90
-
91
-
92
-
93
-
94
-
95
-
96
-
97
-
98
-
99
-
100
-
101
-
102
-
103
-
104
-
105
-
106
-
107
-
108
-
109
-
110
-
111
-
112
-
113
-
114
-
115
-
116
-
117
-
118
-
119
-
120
-
121
-
122
-
123
-
124
-
125
-
126
-
127
-
128
-
129
-
130
-
131
-
132
-
133
-
134
-
135
-
136
-
137
-
138
-
139
-
140
-
141
-
142
-
143
-
144
-
145
-
146
 |
 |
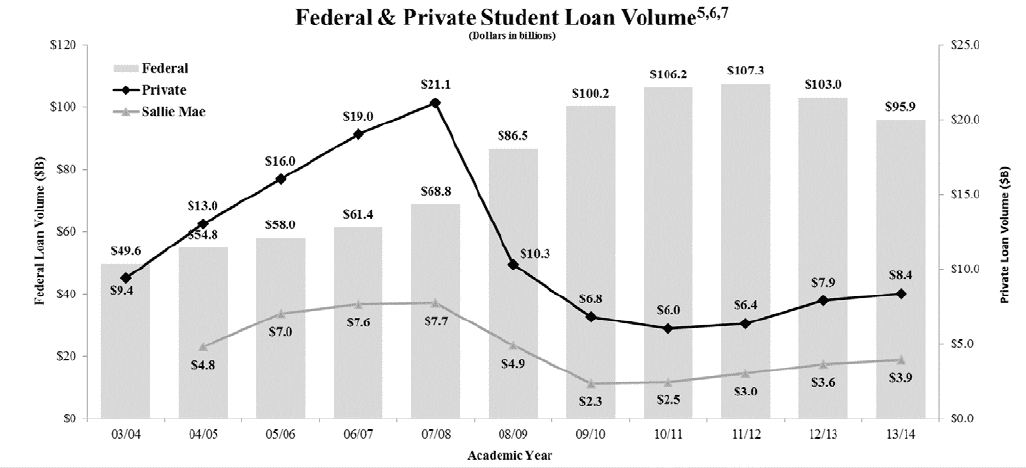
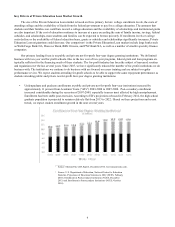
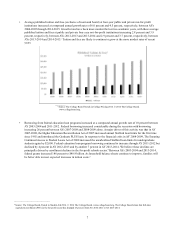
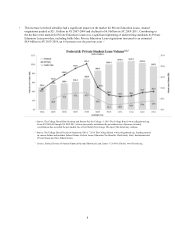
• This increase in federal subsidies had a significant impact on the market for Private Education Loans. Annual
originations peaked at $21.1 billion in AY 2007-2008 and declined to $6.0 billion in AY 2010-2011. Contributing to
the decline in the market for Private Education Loans was a significant tightening of underwriting standards by Private
Education Loan providers, including Sallie Mae. Private Education Loan originations increased to an estimated
$8.4 billion in AY 2013-2014, up 6.0 percent over the previous year. 6,7
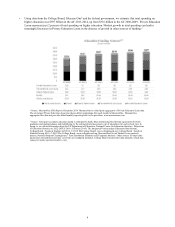
5 Source: The College Board-How Students and Parents Pay for College. © 2013 The College Board. www.collegeboard.org.
Fr o m AY 2 0 08-09 through AY 2012-2013 at four-year public institutions the per student rate of increase in family
contributions has exceeded the per student rate of total family borrowings. We expect this trend may continue.
6 Source: The College Board-Trends in Student Aid 2014. © 2014 The College Board. www.collegeboard.org. Funding sources
in current dollars and includes Federal Grants, Federal Loans, Education Tax Benefits, Work Study, State, Institutional and
Private Grants and Non-Federal Loans.
7 Source: FinAid, History of Student Financial Aid and Historical Loan Limits. © 2014 by FinAid. www.FinAid.org.
8