Sallie Mae 2014 Annual Report Download - page 73
Download and view the complete annual report
Please find page 73 of the 2014 Sallie Mae annual report below. You can navigate through the pages in the report by either clicking on the pages listed below, or by using the keyword search tool below to find specific information within the annual report.
Item 7A. Quantitative and Qualitative Disclosures about Market Risk
Interest Rate Sensitivity Analysis
Our interest rate risk management program seeks to manage and control interest rate risk, thereby reducing our exposure
to fluctuations in interest rates and achieving consistent and acceptable levels of profit in any rate environment, and sustainable
growth in net interest income over the long term. We evaluate and monitor interest rate risk through two primary methods:
• Earnings at Risk (“EAR”), which measures the impact of hypothetical changes in interest rates on net interest income;
and
• Economic Value of Equity (“EVE”), which measures the sensitivity or change in the economic value of equity to
changes in interest rates.
A number of potential interest rate scenarios are simulated using our asset liability management system. The Bank is the
primary source of interest rate risk within the Company. The majority of the Bank’s assets are priced off of 1-month LIBOR.
Therefore, 1-month LIBOR is considered the core rate in our interest rate risk analysis with other interest rate changes
correlated to this rate through a detailed statistical analysis. In addition, each rate is modeled with a floor which indicates how
low each specific rate is likely to move in practice. Rates are adjusted up or down via a set of scenarios that includes both
shocks and ramps. Shocks represent an immediate and sustained change in 1-month LIBOR plus the resulting changes in other
indexes correlated accordingly. Ramps represent a linear increase in 1-month LIBOR over the course of 12 months plus the
resulting changes in other indexes correlated accordingly.
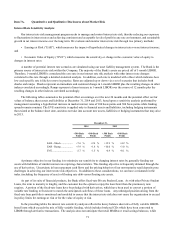
The following tables summarize the potential effect on earnings over the next 24 months and the potential effect on fair
values of balance sheet assets and liabilities at December 31, 2014 and 2013, based upon a sensitivity analysis performed by
management assuming a hypothetical increase in market interest rates of 100 basis points and 300 basis points while funding
spreads remain constant. The EVE sensitivity is applied only to financial assets and liabilities, including hedging instruments
that existed at the balance sheet date, and does not take into account new assets, liabilities or hedging instruments that may arise
in 2015.
December 31,
2014
2013
+300 Basis
Points
+100 Basis
Points
+300 Basis
Points
+100 Basis
Points
EAR - Shock ................
+7.6
%
+2.4
%
+12.9
%
+4.2
%
EAR - Ramp .................
+5.9
%
+1.8
%
+10.0
%
+3.0
%
EVE ............................
-2.7
%
-1.5
%
-0.4
%
+0.1
%
A primary objective in our funding is to minimize our sensitivity to changing interest rates by generally funding our
assets with liabilities of similar interest rate repricing characteristics. This funding objective is frequently obtained through the
use of derivatives. Uncertainty in loan repayment cash flows and the pricing behavior of our non-maturity retail deposits pose
challenges in achieving our interest rate risk objectives. In addition to these considerations, we can have a mismatch in the
index (including the frequency of reset) of floating rate debt versus floating rate assets.
As part of its suite of financial products, the Bank offers fixed-rate Private Student Loans. As with other Private Student
Loans, the term to maturity is lengthy, and the customer has the option to repay the loan faster than the promissory note
requires. A portion of the fixed-rate loans have been hedged with derivatives, which have been used to convert a portion of
variable rate funding to fixed-rate to match the anticipated cash flows of these loans. Any unhedged position arising from the
fixed-rate loan portfolio is monitored and modeled to ensure that the interest rate risk does not cause the organization to exceed
its policy limits for earnings at risk or for the value of equity at risk.
In the preceding tables the interest rate sensitivity analysis reflects the heavy balance sheet mix of fully variable LIBOR-
based loans which exceeds the mix of fully variable funding, which includes brokered CDs which have been converted to
LIBOR through derivative transactions. The analysis does not anticipate that retail MMDA or retail savings balances, while
71


