Sallie Mae 2014 Annual Report Download - page 146
Download and view the complete annual report
Please find page 146 of the 2014 Sallie Mae annual report below. You can navigate through the pages in the report by either clicking on the pages listed below, or by using the keyword search tool below to find specific information within the annual report.-
 1
1 -
2
-
3
-
4
-
5
-
6
-
7
-
8
-
9
-
10
-
11
-
12
-
13
-
14
-
15
-
16
-
17
-
18
-
19
-
20
-
21
-
22
-
23
-
24
-
25
-
26
-
27
-
28
-
29
-
30
-
31
-
32
-
33
-
34
-
35
-
36
-
37
-
38
-
39
-
40
-
41
-
42
-
43
-
44
-
45
-
46
-
47
-
48
-
49
-
50
-
51
-
52
-
53
-
54
-
55
-
56
-
57
-
58
-
59
-
60
-
61
-
62
-
63
-
64
-
65
-
66
-
67
-
68
-
69
-
70
-
71
-
72
-
73
-
74
-
75
-
76
-
77
-
78
-
79
-
80
-
81
-
82
-
83
-
84
-
85
-
86
-
87
-
88
-
89
-
90
-
91
-
92
-
93
-
94
-
95
-
96
-
97
-
98
-
99
-
100
-
101
-
102
-
103
-
104
-
105
-
106
-
107
-
108
-
109
-
110
-
111
-
112
-
113
-
114
-
115
-
116
-
117
-
118
-
119
-
120
-
121
-
122
-
123
-
124
-
125
-
126
-
127
-
128
-
129
-
130
-
131
-
132
-
133
-
134
-
135
-
 136
136 -
 137
137 -
 138
138 -
 139
139 -
 140
140 -
 141
141 -
 142
142 -
 143
143 -
 144
144 -
 145
145 -
 146
146
 |
 |

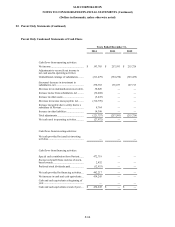
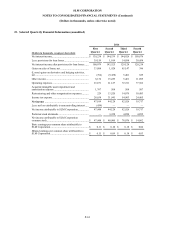
SLM CORPORATION
NOTES TO CONSOLIDATED FINANCIAL STATEMENTS (Continued)
(Dollars in thousands, unless otherwise noted)
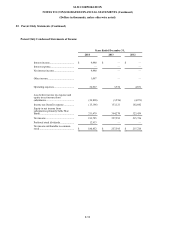
23.
Selected Quarterly Financial Information (unaudited) (Continued)
2013
First
Second
Third
Fourth
(Dollars in thousands, except per share data)
Quarter
Quarter
Quarter
Quarter
Net interest income...................................................
$
115,702
$
107,417
$
116,783
$
122,213
Less: provisions for loan losses ..................................
20,692
(1,015
)
20,404
29,258
Net interest income after provisions for loan losses ......
95,010
108,432
96,379
92,955
Gains on sales of loans, net .......................................
75,222
73,441
43,434
4,496
Gains (losses) on derivative and hedging activities,
net ..........................................................................
610
(52
)
297
(215
)
Other income ...........................................................
7,799
8,665
9,416
75,155
Operating expenses ..................................................
60,771
66,771
68,717
74,215
Acquired intangible asset impairment and
amortization expense ................................................
537
536
1,480
764
Restructuring and other reorganization expenses..........
23
84
—
619
Income tax expense ..................................................
44,765
46,973
30,272
36,923
Net income .............................................................
72,545
76,122
49,057
59,870
Less: net loss attributable to noncontrolling interest .....
(340
)
(347
)
(333
)
(332
)
Net income attributable to SLM Corporation ...............
72,885
76,469
49,390
60,202
Preferred stock dividends ..........................................
—
—
—
—
Net income attributable to SLM Corporation
common stock..........................................................
$
72,885
$
76,469
$
49,390
$
60,202
Basic earnings per common share attributable to
SLM Corporation .....................................................
$
0.16
$
0.17
$
0.11
$
0.14
Diluted earnings per common share attributable to
SLM Corporation .....................................................
$
0.16
$
0.17
$
0.11
$
0.14
F-62