Sallie Mae 2014 Annual Report Download - page 89
Download and view the complete annual report
Please find page 89 of the 2014 Sallie Mae annual report below. You can navigate through the pages in the report by either clicking on the pages listed below, or by using the keyword search tool below to find specific information within the annual report.-
 1
1 -
2
-
3
-
4
-
5
-
6
-
7
-
8
-
9
-
10
-
11
-
12
-
13
-
14
-
15
-
16
-
17
-
18
-
19
-
20
-
21
-
22
-
23
-
24
-
25
-
26
-
27
-
28
-
29
-
30
-
31
-
32
-
33
-
34
-
35
-
36
-
37
-
38
-
39
-
40
-
41
-
42
-
43
-
44
-
45
-
46
-
47
-
48
-
49
-
50
-
51
-
52
-
53
-
54
-
55
-
56
-
57
-
58
-
59
-
60
-
61
-
62
-
63
-
64
-
65
-
66
-
67
-
68
-
69
-
70
-
71
-
72
-
73
-
74
-
75
-
76
-
77
-
78
-
 79
79 -
 80
80 -
 81
81 -
 82
82 -
 83
83 -
 84
84 -
 85
85 -
 86
86 -
 87
87 -
 88
88 -
 89
89 -
 90
90 -
 91
91 -
 92
92 -
 93
93 -
 94
94 -
 95
95 -
 96
96 -
 97
97 -
 98
98 -
 99
99 -
100
-
101
-
102
-
103
-
104
-
105
-
106
-
107
-
108
-
109
-
110
-
111
-
112
-
113
-
114
-
115
-
116
-
117
-
118
-
119
-
120
-
121
-
122
-
123
-
124
-
125
-
126
-
127
-
128
-
129
-
130
-
131
-
132
-
133
-
134
-
135
-
136
-
137
-
138
-
139
-
140
-
141
-
142
-
143
-
144
-
145
-
146
 |
 |

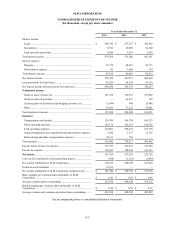
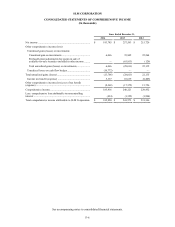
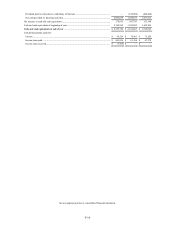
SLM CORPORATION
CONSOLIDATED STATEMENTS OF INCOME
(In thousands, except per share amounts)
Years Ended December 31,
2014
2013
2012
Interest income:
Loans ....................................................................................
$
660,792
$
527,257
$
462,642
Investments ............................................................................
8,913
20,090
26,340
Cash and cash equivalents ........................................................
4,589
3,853
2,299
Total interest income .................................................................
674,294
551,200
491,281
Interest expense:
Deposits .................................................................................
95,774
88,019
82,173
Other interest expense .............................................................
41
1,066
739
Total interest expense ................................................................
95,815
89,085
82,912
Net interest income ....................................................................
578,479
462,115
408,369
Less: provisions for loan losses ...................................................
85,529
69,339
66,116
Net interest income after provisions for loan losses .......................
492,950
392,776
342,253
Noninterest income:
Gains on sales of loans, net ......................................................
121,359
196,593
235,202
Gains on sales of securities ......................................................
—
63,813
129
(Losses) gains on derivatives and hedging activities, net .............
(3,996
)
640
(5,461
)
Other .....................................................................................
39,921
37,222
36,641
Total noninterest income ............................................................
157,284
298,268
266,511
Expenses:
Compensation and benefits ......................................................
129,709
106,799
109,575
Other operating expenses .........................................................
145,172
163,675
144,195
Total operating expenses ..........................................................
274,881
270,474
253,770
Acquired intangible asset impairment and amortization expense ..
3,290
3,317
13,125
Restructuring and other reorganization expenses ........................
38,311
726
—
Total expenses ..........................................................................
316,482
274,517
266,895
Income before income tax expense ..............................................
333,752
416,527
341,869
Income tax expense ...................................................................
139,967
158,934
126,143
Net income ..............................................................................
193,785
257,593
215,726
Less: net loss attributable to noncontrolling interest ......................
(434
)
(1,352
)
(1,894
)
Net income attributable to SLM Corporation ................................
194,219
258,945
217,620
Preferred stock dividends ...........................................................
12,933
—
—
Net income attributable to SLM Corporation common stock ..........
$
181,286
$
258,945
$
217,620
Basic earnings per common share attributable to SLM
Corporation ..............................................................................
$
0.43
$
0.59
$
0.46
Average common shares outstanding ...........................................
423,970
440,108
476,118
Diluted earnings per common share attributable to SLM
Corporation ..............................................................................
$
0.42
$
0.58
$
0.45
Average common and common equivalent shares outstanding ........
432,269
448,549
482,892
See accompanying notes to consolidated financial statements.
F-5