Sallie Mae 2014 Annual Report Download - page 11
Download and view the complete annual report
Please find page 11 of the 2014 Sallie Mae annual report below. You can navigate through the pages in the report by either clicking on the pages listed below, or by using the keyword search tool below to find specific information within the annual report.-
 1
1 -
 2
2 -
 3
3 -
 4
4 -
 5
5 -
 6
6 -
 7
7 -
 8
8 -
 9
9 -
 10
10 -
 11
11 -
 12
12 -
 13
13 -
 14
14 -
 15
15 -
 16
16 -
 17
17 -
 18
18 -
 19
19 -
 20
20 -
 21
21 -
 22
22 -
23
-
24
-
25
-
26
-
27
-
28
-
29
-
30
-
31
-
32
-
33
-
34
-
35
-
36
-
37
-
38
-
39
-
40
-
41
-
42
-
43
-
44
-
45
-
46
-
47
-
48
-
49
-
50
-
51
-
52
-
53
-
54
-
55
-
56
-
57
-
58
-
59
-
60
-
61
-
62
-
63
-
64
-
65
-
66
-
67
-
68
-
69
-
70
-
71
-
72
-
73
-
74
-
75
-
76
-
77
-
78
-
79
-
80
-
81
-
82
-
83
-
84
-
85
-
86
-
87
-
88
-
89
-
90
-
91
-
92
-
93
-
94
-
95
-
96
-
97
-
98
-
99
-
100
-
101
-
102
-
103
-
104
-
105
-
106
-
107
-
108
-
109
-
110
-
111
-
112
-
113
-
114
-
115
-
116
-
117
-
118
-
119
-
120
-
121
-
122
-
123
-
124
-
125
-
126
-
127
-
128
-
129
-
130
-
131
-
132
-
133
-
134
-
135
-
136
-
137
-
138
-
139
-
140
-
141
-
142
-
143
-
144
-
145
-
146
 |
 |
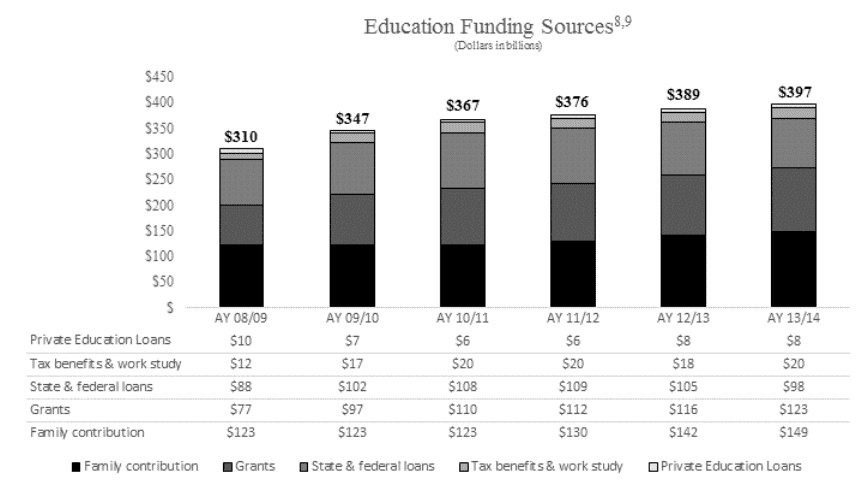
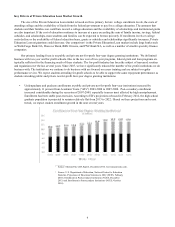
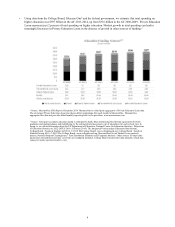
• Using data from the College Board, Measure One8 and the federal government, we estimate that total spending on
higher education was $397 billion in the AY 2013-2014, up from $310 billion in the AY 2008-2009. Private Education
Loans represent just 2 percent of total spending on higher education. Modest growth in total spending can lead to
meaningful increases in Private Education Loans in the absence of growth in other sources of funding.9
8 Source: MearureOne CBA Report, December 2014. MeasureOne is a third party aggregator of Private Education Loan data.
The six largest Private Education Loan providers submit originations data each month to MeasureOne. MeasureOne
aggregates this data and provides blind monthly reporting back to the providers. www.measureone.com
9 Source: Total post-secondary education spend is estimated by Sallie Mae determining the full-time equivalents for both
graduates and undergraduates and multiplying by the estimated total per person cost of attendance for each school type. In
doing so, we utilize information from the US Department of Education, National Center for Education Statistics, Projections
of Education Statistics to 2022 (NCES 2014-, February 2014), The Integrated Postsecondary Education Data System,
College Board -Trends in Student Aid 2014. © 2014 The College Board. www.collegeboard.org, College Board -Trends in
Student Pricing 2014. © 2014 The College Board. www.collegeboard.org, MeasureOne Private Student Loan quarterly
dataset, National Student Clearinghouse - Term Enrollment Estimates and Company Analysis. Other sources for these data
points also exist publicly and may vary from our computed estimates. College Board restates their data annually, which may
cause previously reported results to vary.
9