Sallie Mae 2014 Annual Report Download - page 128
Download and view the complete annual report
Please find page 128 of the 2014 Sallie Mae annual report below. You can navigate through the pages in the report by either clicking on the pages listed below, or by using the keyword search tool below to find specific information within the annual report.-
 1
1 -
2
-
3
-
4
-
5
-
6
-
7
-
8
-
9
-
10
-
11
-
12
-
13
-
14
-
15
-
16
-
17
-
18
-
19
-
20
-
21
-
22
-
23
-
24
-
25
-
26
-
27
-
28
-
29
-
30
-
31
-
32
-
33
-
34
-
35
-
36
-
37
-
38
-
39
-
40
-
41
-
42
-
43
-
44
-
45
-
46
-
47
-
48
-
49
-
50
-
51
-
52
-
53
-
54
-
55
-
56
-
57
-
58
-
59
-
60
-
61
-
62
-
63
-
64
-
65
-
66
-
67
-
68
-
69
-
70
-
71
-
72
-
73
-
74
-
75
-
76
-
77
-
78
-
79
-
80
-
81
-
82
-
83
-
84
-
85
-
86
-
87
-
88
-
89
-
90
-
91
-
92
-
93
-
94
-
95
-
96
-
97
-
98
-
99
-
100
-
101
-
102
-
103
-
104
-
105
-
106
-
107
-
108
-
109
-
110
-
111
-
112
-
113
-
114
-
115
-
116
-
117
-
 118
118 -
 119
119 -
 120
120 -
 121
121 -
 122
122 -
 123
123 -
 124
124 -
 125
125 -
 126
126 -
 127
127 -
 128
128 -
 129
129 -
 130
130 -
 131
131 -
 132
132 -
 133
133 -
 134
134 -
 135
135 -
 136
136 -
 137
137 -
 138
138 -
139
-
140
-
141
-
142
-
143
-
144
-
145
-
146
 |
 |

SLM CORPORATION
NOTES TO CONSOLIDATED FINANCIAL STATEMENTS (Continued)
(Dollars in thousands, unless otherwise noted)
14.
Stock-Based Compensation Plans and Arrangements (Continued)
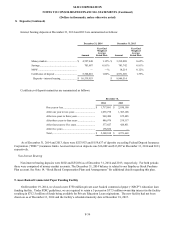
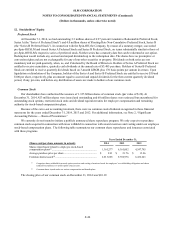
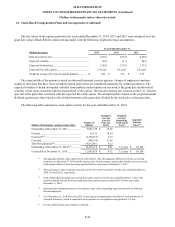
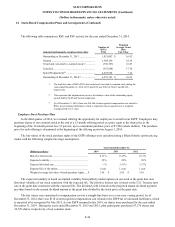
The fair values of the options granted in the years ended December 31, 2014, 2013 and 2012 were estimated as of the
grant date using a Black-Scholes option pricing model with the following weighted average assumptions:
Years Ended December 31,
(Dollars per share)
2014
2013
2012
Risk-free interest rate ...................................................
0.76
%
0.65
%
0.60
%
Expected volatility .......................................................
26
%
31
%
44
%
Expected dividend rate .................................................
2.48
%
3.35
%
3.13
%
Expected life of the option ............................................
2.9 years
2.8 years
2.8 years
Weighted average fair value of options granted ...............
$
3.48
$
3.11
$
4.12
The expected life of the options is based on observed historical exercise patterns. Groups of employees (and non-
employee directors) that have received similar option grant terms are considered separately for valuation purposes. The
expected volatility is based on implied volatility from publicly traded options on our stock at the grant date and historical
volatility of our stock consistent with the expected life of the option. The risk-free interest rate is based on the U.S. Treasury
spot rate at the grant date consistent with the expected life of the option. The dividend yield is based on the projected annual
dividend payment per share based on the dividend amount at the grant date, divided by the stock price at the grant date.
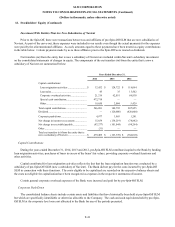
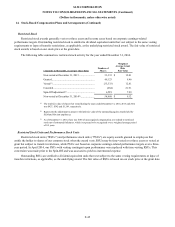
The following table summarizes stock option activity for the year ended December 31, 2014.
(Dollars in thousands, except per share data)
Number of
Options
Weighted
Average
Exercise
Price per
Share
Weighted
Average
Remaining
Contractual
Term
Aggregate
Intrinsic
Value
(1)
Outstanding at December 31, 2013 ..................
3,851,120
$
14.60
Granted ........................................................
16,132
24.24
Exercised(2)(3) ................................................
(2,196,575
)
6.19
Canceled ......................................................
(148,159
)
21.86
Spin-Off adjustment(4) ....................................
14,632,601
8.22
Outstanding at December 31, 2014(5)(6) ............
16,155,119
$
9.91
3.2 years
$
62,144
Exercisable at December 31, 2014 ...................
12,985,828
$
8.32
3.2 years
$
50,154
(1) The aggregate intrinsic value represents the total intrinsic value (the aggregate difference between our closing
stock price on December 31, 2014 and the exercise price of in-the-money options) that would have been received
by the option holders if all in-the-money options had been exercised on December 31, 2014.
(2) The total intrinsic value of options exercised was $11,430, $8,467 and $5,410 for the years ended December 31,
2014, 2013 and 2012, respectively.
(3) Cash of Fifty-three thousand was received from option exercises for the year ended December 31, 2014. The
actual tax benefit realized for the tax deductions from option exercises totaled $4,853 for the year ended
December 31, 2014.
(4) Represents the adjustment to preserve the intrinsic value of the outstanding equity awards held by SLM and
Navient employees.
(5) As of December 31, 2014, there was $362 of unrecognized compensation cost related to stock options net of
estimated forfeitures, which is expected to be recognized over a weighted average period of 1.0 year.
(6) For net-settled options, gross number is reflected.
F-44