Sallie Mae 2014 Annual Report Download - page 53
Download and view the complete annual report
Please find page 53 of the 2014 Sallie Mae annual report below. You can navigate through the pages in the report by either clicking on the pages listed below, or by using the keyword search tool below to find specific information within the annual report.-
 1
1 -
2
-
3
-
4
-
5
-
6
-
7
-
8
-
9
-
10
-
11
-
12
-
13
-
14
-
15
-
16
-
17
-
18
-
19
-
20
-
21
-
22
-
23
-
24
-
25
-
26
-
27
-
28
-
29
-
30
-
31
-
32
-
33
-
34
-
35
-
36
-
37
-
38
-
39
-
40
-
41
-
42
-
 43
43 -
 44
44 -
 45
45 -
 46
46 -
 47
47 -
 48
48 -
 49
49 -
 50
50 -
 51
51 -
 52
52 -
 53
53 -
 54
54 -
 55
55 -
 56
56 -
 57
57 -
 58
58 -
 59
59 -
 60
60 -
 61
61 -
 62
62 -
 63
63 -
64
-
65
-
66
-
67
-
68
-
69
-
70
-
71
-
72
-
73
-
74
-
75
-
76
-
77
-
78
-
79
-
80
-
81
-
82
-
83
-
84
-
85
-
86
-
87
-
88
-
89
-
90
-
91
-
92
-
93
-
94
-
95
-
96
-
97
-
98
-
99
-
100
-
101
-
102
-
103
-
104
-
105
-
106
-
107
-
108
-
109
-
110
-
111
-
112
-
113
-
114
-
115
-
116
-
117
-
118
-
119
-
120
-
121
-
122
-
123
-
124
-
125
-
126
-
127
-
128
-
129
-
130
-
131
-
132
-
133
-
134
-
135
-
136
-
137
-
138
-
139
-
140
-
141
-
142
-
143
-
144
-
145
-
146
 |
 |

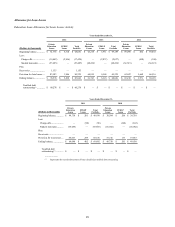
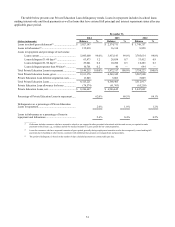
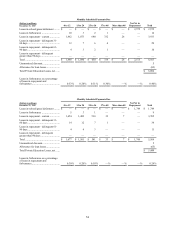
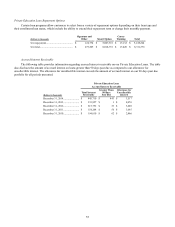
The table below presents our Private Education Loan delinquency trends. Loans in repayment includes in-school loans
making interest only and fixed payments as well as loans that have entered full principal and interest repayment status after any
applicable grace period.
December 31,
2014
2013
2012
(Dollars in thousands)
Balance
%
Balance
%
Balance
%
Loans in-school/grace/deferment(1) ..............................
$
3,027,143
$
2,574,711
$
1,748,757
Loans in forbearance(2) ...............................................
135,018
16,314
8,928
Loans in repayment and percentage of each status:
Loans current ...................................................
5,045,600
98.0
%
3,933,143
99.0
%
3,705,634
98.8
%
Loans delinquent 31-60 days(3) ..........................
63,873
1.2
28,854
0.7
33,412
0.9
Loans delinquent 61-90 days(3) ..........................
29,041
0.6
10,280
0.3
10,483
0.3
Loans delinquent greater than 90 days(3) .............
10,701
0.2
40
—
694
—
Total Private Education Loans in repayment .................
5,149,215
100.0
%
3,972,317
100.0
%
3,750,223
100.0
%
Total Private Education Loans, gross ...........................
8,311,376
6,563,342
5,507,908
Private Education Loan deferred origination costs .........
13,845
5,063
5,009
Total Private Education Loans .....................................
8,325,221
6,568,405
5,512,917
Private Education Loan allowance for losses ................
(78,574
)
(61,763
)
(65,218
)
Private Education Loans, net .......................................
$
8,246,647
$
6,506,642
$
5,447,699
Percentage of Private Education Loans in repayment .....
62.0
%
60.5
%
68.1
%
Delinquencies as a percentage of Private Education
Loans in repayment....................................................
2.0
%
1.0
%
1.2
%
Loans in forbearance as a percentage of loans in
repayment and forbearance .........................................
2.6
%
0.4
%
0.2
%
_________
(1) Deferment includes customers who have returned to school or are engaged in other permitted educational activities and are not yet required to make
payments on their loans, e.g., residency periods for medical students or a grace period for bar exam preparation.
(2) Loans for customers who have requested extension of grace period generally during employment transition or who have temporarily ceased making full
payments due to hardship or other factors, consistent with established loan program servicing policies and procedures.
(3) The period of delinquency is based on the number of days scheduled payments are contractually past due.
51