Sallie Mae 2014 Annual Report Download - page 49
Download and view the complete annual report
Please find page 49 of the 2014 Sallie Mae annual report below. You can navigate through the pages in the report by either clicking on the pages listed below, or by using the keyword search tool below to find specific information within the annual report.-
 1
1 -
2
-
3
-
4
-
5
-
6
-
7
-
8
-
9
-
10
-
11
-
12
-
13
-
14
-
15
-
16
-
17
-
18
-
19
-
20
-
21
-
22
-
23
-
24
-
25
-
26
-
27
-
28
-
29
-
30
-
31
-
32
-
33
-
34
-
35
-
36
-
37
-
38
-
 39
39 -
 40
40 -
 41
41 -
 42
42 -
 43
43 -
 44
44 -
 45
45 -
 46
46 -
 47
47 -
 48
48 -
 49
49 -
 50
50 -
 51
51 -
 52
52 -
 53
53 -
 54
54 -
 55
55 -
 56
56 -
 57
57 -
 58
58 -
 59
59 -
60
-
61
-
62
-
63
-
64
-
65
-
66
-
67
-
68
-
69
-
70
-
71
-
72
-
73
-
74
-
75
-
76
-
77
-
78
-
79
-
80
-
81
-
82
-
83
-
84
-
85
-
86
-
87
-
88
-
89
-
90
-
91
-
92
-
93
-
94
-
95
-
96
-
97
-
98
-
99
-
100
-
101
-
102
-
103
-
104
-
105
-
106
-
107
-
108
-
109
-
110
-
111
-
112
-
113
-
114
-
115
-
116
-
117
-
118
-
119
-
120
-
121
-
122
-
123
-
124
-
125
-
126
-
127
-
128
-
129
-
130
-
131
-
132
-
133
-
134
-
135
-
136
-
137
-
138
-
139
-
140
-
141
-
142
-
143
-
144
-
145
-
146
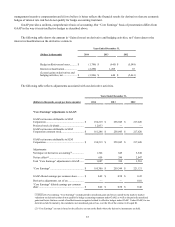
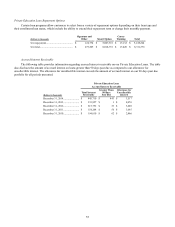
 |
 |

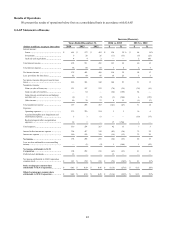
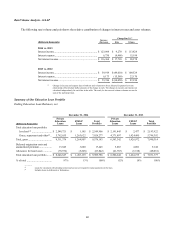
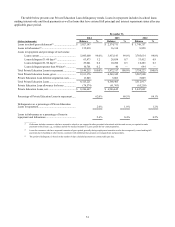
December 31, 2012
December 31, 2011
(Dollars in thousands)
Private
Education
Loans
FFELP
Loans
Total
Portfolio
Private
Education
Loans
FFELP
Loans
Total
Portfolio
Total education loan portfolio .......
$
5,447,699
$
1,039,755
$
6,487,454
$
5,062,788
$
239,452
$
5,302,240
% of total ....................................
84
%
16
%
100
%
95
%
5
%
100
%
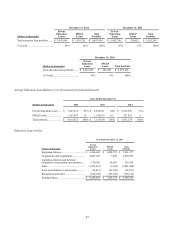
December 31, 2010
(Dollars in thousands)
Private
Education
Loans
FFELP
Loans
Total Portfolio
Total education loan portfolio .......
$
4,457,244
$
202,226
$
4,659,470
% of total ...................................
96
%
4
%
100
%
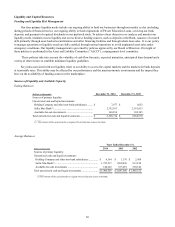
Average Education Loan Balances (net of unamortized premium/discount)
Years Ended December 31,
(Dollars in thousands)
2014
2013
2012
Private Education Loans .....
$
7,563,356
85
%
$
5,996,651
84
%
$
5,347,239
91
%
FFELP Loans .....................
1,353,497
15
1,142,979
16
527,935
9
Total portfolio ....................
$
8,916,853
100
%
$
7,139,630
100
%
$
5,875,174
100
%
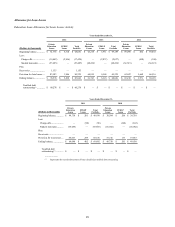
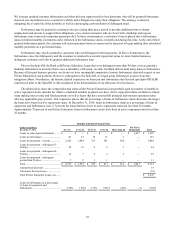
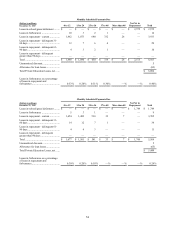
Education Loan Activity
Year Ended December 31, 2014
(Dollars in thousands)
Private
Education
Loans
FFELP
Loans
Total
Portfolio
Beginning balance .................................
$
6,506,642
$
1,424,735
$
7,931,377
Acquisitions and originations..................
4,087,320
7,470
4,094,790
Capitalized interest and deferred
origination cost premium amortization.....
170,306
46,093
216,399
Sales ....................................................
(1,873,414
)
(7,654
)
(1,881,068
)
Loan consolidation to third parties ..........
(14,811
)
(41,760
)
(56,571
)
Repayments and other ............................
(629,396
)
(165,745
)
(795,141
)
Ending balance .....................................
$
8,246,647
$
1,263,139
$
9,509,786
47