Sallie Mae 2014 Annual Report Download - page 37
Download and view the complete annual report
Please find page 37 of the 2014 Sallie Mae annual report below. You can navigate through the pages in the report by either clicking on the pages listed below, or by using the keyword search tool below to find specific information within the annual report.-
 1
1 -
2
-
3
-
4
-
5
-
6
-
7
-
8
-
9
-
10
-
11
-
12
-
13
-
14
-
15
-
16
-
17
-
18
-
19
-
20
-
21
-
22
-
23
-
24
-
25
-
26
-
 27
27 -
 28
28 -
 29
29 -
 30
30 -
 31
31 -
 32
32 -
 33
33 -
 34
34 -
 35
35 -
 36
36 -
 37
37 -
 38
38 -
 39
39 -
 40
40 -
 41
41 -
 42
42 -
 43
43 -
 44
44 -
 45
45 -
 46
46 -
 47
47 -
48
-
49
-
50
-
51
-
52
-
53
-
54
-
55
-
56
-
57
-
58
-
59
-
60
-
61
-
62
-
63
-
64
-
65
-
66
-
67
-
68
-
69
-
70
-
71
-
72
-
73
-
74
-
75
-
76
-
77
-
78
-
79
-
80
-
81
-
82
-
83
-
84
-
85
-
86
-
87
-
88
-
89
-
90
-
91
-
92
-
93
-
94
-
95
-
96
-
97
-
98
-
99
-
100
-
101
-
102
-
103
-
104
-
105
-
106
-
107
-
108
-
109
-
110
-
111
-
112
-
113
-
114
-
115
-
116
-
117
-
118
-
119
-
120
-
121
-
122
-
123
-
124
-
125
-
126
-
127
-
128
-
129
-
130
-
131
-
132
-
133
-
134
-
135
-
136
-
137
-
138
-
139
-
140
-
141
-
142
-
143
-
144
-
145
-
146
 |
 |
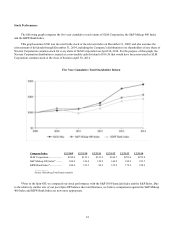
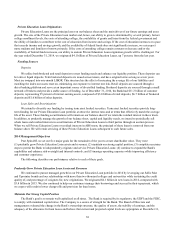
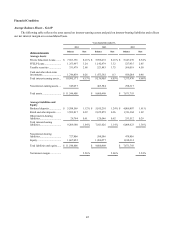
Net Interest Income
The most significant portion of our earnings is generated by the spread between the interest income we receive on assets
in our education loan portfolios and the interest expense we pay on funds we use to originate these loans. We report these
earnings as net interest income.
Net interest income is predominantly determined by the balance of Private Education Loans. As of December 31, 2014,
we held $8.3 billion and $1.3 billion of Private Education and FFELP Loans, respectively. For Private Education Loans and
FFELP Loans, net interest margin is determined by the interest on our interest earning assets less our cost of funds. The
majority of our interest income comes from our Private Education Loan portfolio which earns variable rate interest and is
funded primarily with deposits. Our cost of funds is primarily influenced by competition in the deposit market and by the
overall level of interest rates.
FFELP Loans carry lower risk and have a much lower net interest margin as a result of the federal government guarantee
supporting these loans. We do not expect to acquire any more FFELP Loans and the balance of our FFELP portfolio is expected
to decline due to normal amortization.
Gains on Sale of Loans, Net
To prudently manage the growth of our balance sheet, capital and liquidity needs and to generate non-interest income we
intend to periodically sell Private Education Loans to third parties through an auction process. We intend to retain servicing of
these Private Education Loans subsequent to their sale at prevailing market rates for such services. We will execute this strategy
through the sale of whole loans or securitizing a loan portfolio and selling the senior bonds as well as the residual interest in the
securitization trust. Both strategies effectively deconsolidate the loans from our balance sheet and generate cash income for the
company. Prior to the Spin-Off the Bank sold loans to an affiliate (now Navient) when the loans became 90 days delinquent and
to facilitate securitization transactions. Subsequent to the Spin-Off, we sold $1.2 billion of loans during 2014, through whole
loan sales to Navient and a securitization transaction with a third party. We recorded gains of $85 million on those sales. See
notes to consolidated financial statements, Note 16, “Arrangements with Navient Corporation,” for further discussion regarding
loan purchase agreements.
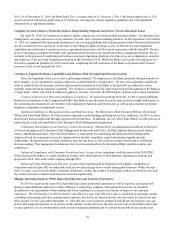
Allowance for Loan Losses
Management estimates and maintains an allowance for loan losses for Private Education Loans at a level sufficient to
cover charge-offs expected over the next year, plus an additional allowance to cover life-of-loan expected losses for loans
classified as a troubled debt restructuring (“TDR”). The allowance for loan losses is increased when we record provision
expense and for recoveries and is reduced by charge-offs. Generally, the provision for loan losses and the allowance for loan
losses rise when charge-offs are expected to increase and fall when charge-offs are expected to decline. We bear the full credit
exposure on our Private Education Loans. Losses on our Private Education Loans are determined by risk characteristics such as
loan status (in-school, grace, forbearance, repayment and delinquency), loan seasoning (number of months in active
repayment), underwriting criteria (e.g., credit scores), presence of a cosigner and the current economic environment. Losses
typically emerge once a borrower completes school and enters full principal and interest repayment after their grace period
ends. Our experience indicates that approximately 50 percent of expected losses on loans can occur in the first two years after a
loan enters full principal and interest repayment. Therefore, changes in our allowance for loan losses will be driven by the
amount and age of our loans in full principal and interest repayment. At December 31, 2014, 28 percent of our portfolio of
Private Education Loans have entered full principal and interest repayment status after any applicable grace periods.
Our provision for loan losses on our Private Education Loans was $84 million for the year ended December 31, 2014
compared with $65 million in 2013. Our allowance for loan losses was $79 million at December 31, 2014 compared to
$62 million at the prior year-end. In connection with the Spin-Off, we changed our policy of charging off Private Education
Loans when they are delinquent for 212 days to charging off loans after they are 120 days delinquent. In addition, we changed
our loss confirmation period for Private Education Loans from two years to one year to reflect the shorter charge-off period and
recent changes in our servicing practices. A loss confirmation period represents the expected period between a loss event and
when management considers the debt to be uncollectible, taking into consideration account management practices that affect
the timing of a loss, such as the usage of forbearance.
Our loss exposure and resulting provision for losses is small for FFELP Loans because we generally bear a maximum of
three percent loss exposure on them. We maintain an allowance for loan losses for our FFELP Loans at a level sufficient to
cover charge-offs expected over the the next two years. Our provision for losses in our FFELP Loans portfolio was $2 million
for the year ended December 31, 2014 compared with $4 million in 2013.
35