Sallie Mae 2014 Annual Report Download - page 111
Download and view the complete annual report
Please find page 111 of the 2014 Sallie Mae annual report below. You can navigate through the pages in the report by either clicking on the pages listed below, or by using the keyword search tool below to find specific information within the annual report.-
 1
1 -
2
-
3
-
4
-
5
-
6
-
7
-
8
-
9
-
10
-
11
-
12
-
13
-
14
-
15
-
16
-
17
-
18
-
19
-
20
-
21
-
22
-
23
-
24
-
25
-
26
-
27
-
28
-
29
-
30
-
31
-
32
-
33
-
34
-
35
-
36
-
37
-
38
-
39
-
40
-
41
-
42
-
43
-
44
-
45
-
46
-
47
-
48
-
49
-
50
-
51
-
52
-
53
-
54
-
55
-
56
-
57
-
58
-
59
-
60
-
61
-
62
-
63
-
64
-
65
-
66
-
67
-
68
-
69
-
70
-
71
-
72
-
73
-
74
-
75
-
76
-
77
-
78
-
79
-
80
-
81
-
82
-
83
-
84
-
85
-
86
-
87
-
88
-
89
-
90
-
91
-
92
-
93
-
94
-
95
-
96
-
97
-
98
-
99
-
100
-
 101
101 -
 102
102 -
 103
103 -
 104
104 -
 105
105 -
 106
106 -
 107
107 -
 108
108 -
 109
109 -
 110
110 -
 111
111 -
 112
112 -
 113
113 -
 114
114 -
 115
115 -
 116
116 -
 117
117 -
 118
118 -
 119
119 -
 120
120 -
 121
121 -
122
-
123
-
124
-
125
-
126
-
127
-
128
-
129
-
130
-
131
-
132
-
133
-
134
-
135
-
136
-
137
-
138
-
139
-
140
-
141
-
142
-
143
-
144
-
145
-
146
 |
 |

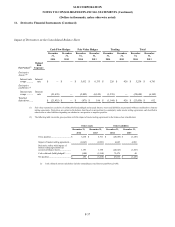
SLM CORPORATION
NOTES TO CONSOLIDATED FINANCIAL STATEMENTS (Continued)
(Dollars in thousands, unless otherwise noted)
6.
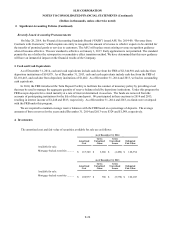
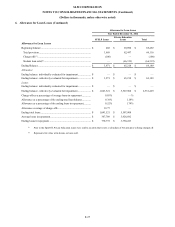
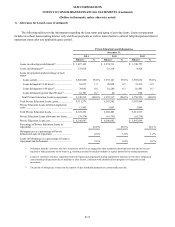
Allowance for Loan Losses (Continued)
Allowance for Loan Losses
Year Ended December 31, 2012
FFELP Loans
Private Education
Loans
Total
Allowance for Loan Losses
Beginning balance .....................................................................
$
402
$
69,090
$
69,492
Total provision ........................................................................
3,669
62,447
66,116
Charge-offs
(1)
..........................................................................
(100
)
—
(100
)
Student loan sales
(2)
.................................................................
—
(66,319
)
(66,319
)
Ending Balance .........................................................................
$
3,971
$
65,218
$
69,189
Allowance:
Ending balance: individually evaluated for impairment..................
$
—
$
—
$
—
Ending balance: collectively evaluated for impairment ..................
$
3,971
$
65,218
$
69,189
Loans:
Ending balance: individually evaluated for impairment..................
$
—
$
—
$
—
Ending balance: collectively evaluated for impairment ..................
$
1,043,521
$
5,507,908
$
6,551,429
Charge-offs as a percentage of average loans in repayment ............
0.03
%
—
%
Allowance as a percentage of the ending total loan balance ............
0.38
%
1.18
%
Allowance as a percentage of the ending loans in repayment ..........
0.52
%
1.74
%
Allowance coverage of charge-offs ..............................................
39.77
—
Ending total loans ......................................................................
$
1,043,521
$
5,507,908
Average loans in repayment ........................................................
$
367,789
$
3,928,692
Ending loans in repayment .........................................................
$
770,772
$
3,750,223
(1) Prior to the Spin-Off, Private Education Loans were sold to an entity that is now a subsidiary of Navient prior to being charged off.
(2) Represents fair value write-downs on loans sold.
F-27