Sallie Mae 2014 Annual Report Download - page 74
Download and view the complete annual report
Please find page 74 of the 2014 Sallie Mae annual report below. You can navigate through the pages in the report by either clicking on the pages listed below, or by using the keyword search tool below to find specific information within the annual report.-
 1
1 -
2
-
3
-
4
-
5
-
6
-
7
-
8
-
9
-
10
-
11
-
12
-
13
-
14
-
15
-
16
-
17
-
18
-
19
-
20
-
21
-
22
-
23
-
24
-
25
-
26
-
27
-
28
-
29
-
30
-
31
-
32
-
33
-
34
-
35
-
36
-
37
-
38
-
39
-
40
-
41
-
42
-
43
-
44
-
45
-
46
-
47
-
48
-
49
-
50
-
51
-
52
-
53
-
54
-
55
-
56
-
57
-
58
-
59
-
60
-
61
-
62
-
63
-
 64
64 -
 65
65 -
 66
66 -
 67
67 -
 68
68 -
 69
69 -
 70
70 -
 71
71 -
 72
72 -
 73
73 -
 74
74 -
 75
75 -
 76
76 -
 77
77 -
 78
78 -
 79
79 -
 80
80 -
 81
81 -
 82
82 -
 83
83 -
 84
84 -
85
-
86
-
87
-
88
-
89
-
90
-
91
-
92
-
93
-
94
-
95
-
96
-
97
-
98
-
99
-
100
-
101
-
102
-
103
-
104
-
105
-
106
-
107
-
108
-
109
-
110
-
111
-
112
-
113
-
114
-
115
-
116
-
117
-
118
-
119
-
120
-
121
-
122
-
123
-
124
-
125
-
126
-
127
-
128
-
129
-
130
-
131
-
132
-
133
-
134
-
135
-
136
-
137
-
138
-
139
-
140
-
141
-
142
-
143
-
144
-
145
-
146
 |
 |

relatively sensitive to interest rate changes, will reprice to the full extent of interest rate shocks or ramps. Partially offsetting this
asset sensitive position, is (i) the impact of FFELP loans which receive Floor Income in low interest rate environments, and
will therefore not reprice fully with interest rate shocks and (ii) the impact of a portion of our fixed-rate loans which have not
been fully match-funded through derivative transactions. The overall asset-sensitive position will generally cause net interest
income to increase when interest rates rise.
Although we believe that these measurements provide an estimate of our interest rate sensitivity, they do not account
for potential changes in credit quality and size of our balance sheet. They also do not account for other business developments
that could affect net income, or for management actions that could affect net income or that could be taken to change our risk
profile. Accordingly, we can give no assurance that actual results would not differ materially from the estimated outcomes of
our simulations. Further, such simulations do not represent our current view of expected future interest rate movements.
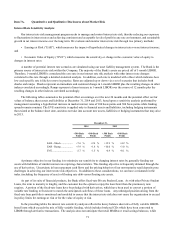
Asset and Liability Funding Gap
The tables below present our assets and liabilities (funding) arranged by underlying indices as of December 31, 2014. In
the following GAAP presentation, the funding gap only includes derivatives that qualify as effective hedges (those derivatives
which are reflected in net interest margin, as opposed to those reflected in the “gains (losses) on derivatives and hedging
activities, net” line on the consolidated statements of income). The difference between the asset and the funding is the funding
gap for the specified index. This represents our exposure to interest rate risk in the form of basis risk and repricing risk, which
is the risk that the different indices may reset at different frequencies or may not move in the same direction or at the same
magnitude. (Note that all fixed-rate assets and liabilities are aggregated into one line item, which does not capture the
differences in time due to maturity.)
(Dollars in billions)
Index
Frequency of
Variable
Resets
Assets
Funding
(1)
Funding
Gap
3-month Treasury bill
weekly
$
0.2
$
—
$
0.2
3-month LIBOR
quarterly
—
0.4
(0.4
)
1-month LIBOR
monthly
6.9
3.8
3.1
1-month LIBOR
weekly
—
0.6
(0.6
)
1-month LIBOR
daily
1.1
—
1.1
Non-Discrete reset(2)
daily/weekly
2.4
2.8
(0.4
)
Fixed-Rate(3)
2.4
5.4
(3.0
)
Total
$
13.0
$
13.0
$
—
(1) Funding (by index) includes all derivatives that qualify as hedges.
(2) Assets include restricted and unrestricted cash equivalents and other overnight type instruments. Funding includes
liquid retail deposits and the obligation to return cash collateral held related to derivatives exposures.
(3) Assets include receivables and other assets (including premiums and reserves). Funding includes unswapped time deposits,
liquid MMDA's swapped to fixed-rates and stockholders' equity.
The “Funding Gap” in the above table shows primarily mismatches in the 1-month LIBOR assets with fixed-rate and
Non-Discrete funding. We consider the risk to be moderate since the funding in the Non-Discrete bucket is our liquid retail
portfolio which we have significant flexibility to reprice at any time, and the funding in the fixed bucket includes $1.4 billion of
equity and $0.6 billion of non interest bearing liabilities.
We use interest rate swaps and other derivatives to achieve our risk management objectives. Our asset liability
management strategy is to match assets with debt (in combination with derivatives) that have the same underlying index and
reset frequency or have interest rate characteristics that we believe are highly correlated. The use of funding with index types
and reset frequencies that are different from our assets exposes us to interest rate risk in the form of basis and repricing risk.
This could result in our cost of funds not moving in the same direction or with the same magnitude as the yield on our assets.
While we believe this risk is low, as all of these indices, are short-term with rate movements that are highly correlated over a
long period of time, market disruptions (which have occurred in recent years) can lead to a temporary divergence between
indices resulting in a negative impact to our earnings.
72