Sallie Mae 2014 Annual Report Download - page 145
Download and view the complete annual report
Please find page 145 of the 2014 Sallie Mae annual report below. You can navigate through the pages in the report by either clicking on the pages listed below, or by using the keyword search tool below to find specific information within the annual report.-
 1
1 -
2
-
3
-
4
-
5
-
6
-
7
-
8
-
9
-
10
-
11
-
12
-
13
-
14
-
15
-
16
-
17
-
18
-
19
-
20
-
21
-
22
-
23
-
24
-
25
-
26
-
27
-
28
-
29
-
30
-
31
-
32
-
33
-
34
-
35
-
36
-
37
-
38
-
39
-
40
-
41
-
42
-
43
-
44
-
45
-
46
-
47
-
48
-
49
-
50
-
51
-
52
-
53
-
54
-
55
-
56
-
57
-
58
-
59
-
60
-
61
-
62
-
63
-
64
-
65
-
66
-
67
-
68
-
69
-
70
-
71
-
72
-
73
-
74
-
75
-
76
-
77
-
78
-
79
-
80
-
81
-
82
-
83
-
84
-
85
-
86
-
87
-
88
-
89
-
90
-
91
-
92
-
93
-
94
-
95
-
96
-
97
-
98
-
99
-
100
-
101
-
102
-
103
-
104
-
105
-
106
-
107
-
108
-
109
-
110
-
111
-
112
-
113
-
114
-
115
-
116
-
117
-
118
-
119
-
120
-
121
-
122
-
123
-
124
-
125
-
126
-
127
-
128
-
129
-
130
-
131
-
132
-
133
-
134
-
 135
135 -
 136
136 -
 137
137 -
 138
138 -
 139
139 -
 140
140 -
 141
141 -
 142
142 -
 143
143 -
 144
144 -
 145
145 -
 146
146
 |
 |

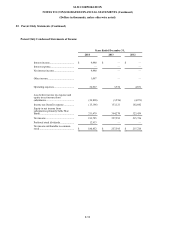
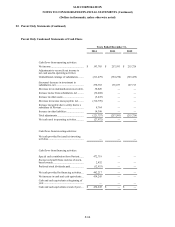
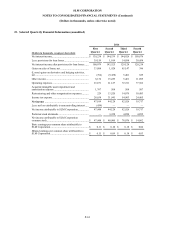
SLM CORPORATION
NOTES TO CONSOLIDATED FINANCIAL STATEMENTS (Continued)
(Dollars in thousands, unless otherwise noted)
23. Selected Quarterly Financial Information (unaudited)
2014
First
Second
Third
Fourth
(Dollars in thousands, except per share data)
Quarter
Quarter
Quarter
Quarter
Net interest income...................................................
$
139,238
$
144,539
$
144,026
$
150,676
Less: provisions for loan losses ..................................
39,159
1,014
14,898
30,458
Net interest income after provisions for loan losses ......
100,079
143,525
129,128
120,218
Gains on sales of loans, net .......................................
33,888
1,928
85,147
396
(Losses) gains on derivative and hedging activities,
net ..........................................................................
(764
)
(9,458
)
5,401
825
Other income ...........................................................
8,136
15,229
5,461
11,095
Operating expenses ..................................................
63,671
61,127
72,721
77,362
Acquired intangible asset impairment and
amortization expense ................................................
1,767
508
508
507
Restructuring and other reorganization expenses..........
229
13,520
14,079
10,483
Income tax expense ..................................................
28,658
31,941
54,903
24,465
Net income .............................................................
47,014
44,128
82,926
19,717
Less: net loss attributable to noncontrolling interest .....
(434
)
—
—
—
Net income attributable to SLM Corporation ...............
47,448
44,128
82,926
19,717
Preferred stock dividends ..........................................
—
3,228
4,850
4,855
Net income attributable to SLM Corporation
common stock..........................................................
$
47,448
$
40,900
$
78,076
$
14,862
Basic earnings per common share attributable to
SLM Corporation .....................................................
$
0.11
$
0.10
$
0.18
$
0.04
Diluted earnings per common share attributable to
SLM Corporation .....................................................
$
0.11
$
0.09
$
0.18
$
0.03
F-61