Sallie Mae 2014 Annual Report Download - page 63
Download and view the complete annual report
Please find page 63 of the 2014 Sallie Mae annual report below. You can navigate through the pages in the report by either clicking on the pages listed below, or by using the keyword search tool below to find specific information within the annual report.-
 1
1 -
2
-
3
-
4
-
5
-
6
-
7
-
8
-
9
-
10
-
11
-
12
-
13
-
14
-
15
-
16
-
17
-
18
-
19
-
20
-
21
-
22
-
23
-
24
-
25
-
26
-
27
-
28
-
29
-
30
-
31
-
32
-
33
-
34
-
35
-
36
-
37
-
38
-
39
-
40
-
41
-
42
-
43
-
44
-
45
-
46
-
47
-
48
-
49
-
50
-
51
-
52
-
 53
53 -
 54
54 -
 55
55 -
 56
56 -
 57
57 -
 58
58 -
 59
59 -
 60
60 -
 61
61 -
 62
62 -
 63
63 -
 64
64 -
 65
65 -
 66
66 -
 67
67 -
 68
68 -
 69
69 -
 70
70 -
 71
71 -
 72
72 -
 73
73 -
74
-
75
-
76
-
77
-
78
-
79
-
80
-
81
-
82
-
83
-
84
-
85
-
86
-
87
-
88
-
89
-
90
-
91
-
92
-
93
-
94
-
95
-
96
-
97
-
98
-
99
-
100
-
101
-
102
-
103
-
104
-
105
-
106
-
107
-
108
-
109
-
110
-
111
-
112
-
113
-
114
-
115
-
116
-
117
-
118
-
119
-
120
-
121
-
122
-
123
-
124
-
125
-
126
-
127
-
128
-
129
-
130
-
131
-
132
-
133
-
134
-
135
-
136
-
137
-
138
-
139
-
140
-
141
-
142
-
143
-
144
-
145
-
146
 |
 |
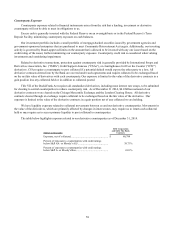
Critical Accounting Policies and Estimates
Management’s Discussion and Analysis of Financial Condition and Results of Operations addresses our consolidated
financial statements, which have been prepared in accordance with GAAP. Note 2, “Significant Accounting Policies” includes
a summary of the significant accounting policies and methods used in the preparation of our consolidated financial statements.
The preparation of these financial statements requires management to make estimates and assumptions that affect the reported
amounts of assets and liabilities and the reported amounts of income and expenses during the reporting periods. Actual results
may differ from these estimates under varying assumptions or conditions. On a quarterly basis, management evaluates its
estimates, particularly those that include the most difficult, subjective or complex judgments and are often about matters that
are inherently uncertain. The most significant judgments, estimates and assumptions relate to the following critical accounting
policies that are discussed in more detail below.
Allowance for Loan Losses
In determining the allowance for loan losses on our Private Education Loan non-TDR portfolio, we estimate the principal
amount of loans that will default over the next year (one year being the expected period between a loss event and default) and
how much we expect to recover over the same one year period related to the defaulted amount. The expected defaults less our
expected recoveries adjusted for any qualitative factors (discussed below) equal the allowance related to this portfolio. Our
historical experience indicates that, on average, the time between the date that a customer experiences a default causing event
(i.e., the loss trigger event) and the date that we charge off the unrecoverable portion of that loan is one year.
In estimating both the non-TDR and TDR allowance amounts, we start with historical experience of customer
delinquency and default behavior. We make judgments about which historical period to start with and then make further
judgments about whether that historical experience is representative of future expectations and whether additional adjustments
may be needed to those historical default rates. We may also take certain other qualitative factors into consideration when
calculating the allowance for loan losses. These qualitative factors include, but are not limited to, changes in the economic
environment, changes in lending policies and procedures, including changes in underwriting standards and collection, charge-
off and recovery practices not already included in the analysis, and the effect of other external factors such as legal and
regulatory requirements on the level of estimated credit losses.
Our non-TDR allowance for loan losses is estimated using an analysis of delinquent and current accounts. Our model is
used to estimate the likelihood that a loan receivable may progress through the various delinquency stages and ultimately
charge off (“migration analysis”). Once a charge-off forecast is estimated, a recovery assumption is layered on top.
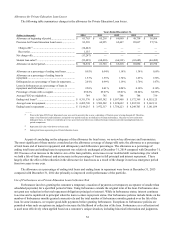
In connection with the Spin-Off, we changed our charge-off policy for Private Education Loans to charging off loans
when the loans reach 120 days delinquent. Pre-Spin-Off SLM default aversion strategies were focused on the final stages of
delinquency, from 150 days to 212 days. Our default aversion strategies are now focused on loans that are 30 to 120 days
delinquent. It is uncertain if our existing default aversion strategies will be as successful in this compressed collection
timeframe. We implemented our 120 day collection strategy in April 2014. For the quarter ended December 31, 2014, we
experienced some level of volatility in the rate at which we are able to cure delinquencies with borrowers as a result of
temporary transitional issues related to the Bank servicing platform in October 2014.
The migration analysis model is based upon sixteen months of actual collection experience which includes seven months
of collection experience using the 212 day charge off default aversion strategies and nine months of experience using the 120
day charge-off default aversion strategies. We only used collection data from the first four collection buckets for all sixteen
months. This resulted in our inclusion of older periods when the accounts were not being aggressively collected in the 30 to
120 days delinquent buckets. We believe this is appropriate as we have very limited data since the change in collection
practices to be confident that the positive trends will continue. Once the quantitative calculation is performed, we review the
adequacy of the allowance for loan losses and determine if qualitative adjustments need to be considered.
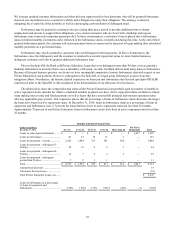
Separately, for our TDR portfolio, we estimate an allowance amount sufficient to cover life-of-loan expected losses
through an impairment calculation based on the difference between the loan’s basis and the present value of expected future
cash flows (which would include life-of-loan default and recovery assumptions) discounted at the loan’s original effective
interest rate. Our TDR portfolio is comprised mostly of loans with interest rate reductions and forbearance usage greater than
three months.
61