Sallie Mae 2014 Annual Report Download - page 113
Download and view the complete annual report
Please find page 113 of the 2014 Sallie Mae annual report below. You can navigate through the pages in the report by either clicking on the pages listed below, or by using the keyword search tool below to find specific information within the annual report.-
 1
1 -
2
-
3
-
4
-
5
-
6
-
7
-
8
-
9
-
10
-
11
-
12
-
13
-
14
-
15
-
16
-
17
-
18
-
19
-
20
-
21
-
22
-
23
-
24
-
25
-
26
-
27
-
28
-
29
-
30
-
31
-
32
-
33
-
34
-
35
-
36
-
37
-
38
-
39
-
40
-
41
-
42
-
43
-
44
-
45
-
46
-
47
-
48
-
49
-
50
-
51
-
52
-
53
-
54
-
55
-
56
-
57
-
58
-
59
-
60
-
61
-
62
-
63
-
64
-
65
-
66
-
67
-
68
-
69
-
70
-
71
-
72
-
73
-
74
-
75
-
76
-
77
-
78
-
79
-
80
-
81
-
82
-
83
-
84
-
85
-
86
-
87
-
88
-
89
-
90
-
91
-
92
-
93
-
94
-
95
-
96
-
97
-
98
-
99
-
100
-
101
-
102
-
 103
103 -
 104
104 -
 105
105 -
 106
106 -
 107
107 -
 108
108 -
 109
109 -
 110
110 -
 111
111 -
 112
112 -
 113
113 -
 114
114 -
 115
115 -
 116
116 -
 117
117 -
 118
118 -
 119
119 -
 120
120 -
 121
121 -
 122
122 -
 123
123 -
124
-
125
-
126
-
127
-
128
-
129
-
130
-
131
-
132
-
133
-
134
-
135
-
136
-
137
-
138
-
139
-
140
-
141
-
142
-
143
-
144
-
145
-
146
 |
 |

SLM CORPORATION
NOTES TO CONSOLIDATED FINANCIAL STATEMENTS (Continued)
(Dollars in thousands, unless otherwise noted)
6.
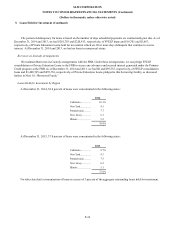
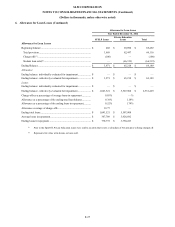
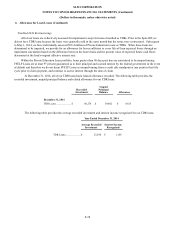
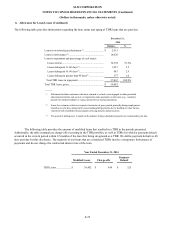
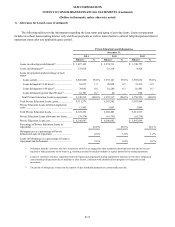
Allowance for Loan Losses (Continued)
The following table provides information regarding the loan status and aging of TDR loans that are past due.
December 31,
2014
Balance
%
Loans in in-school/grace/deferment
(1)
............................
$
2,915
Loans in forbearance
(2)
.................................................
18,620
Loans in repayment and percentage of each status:
Loans current ..........................................................
34,554
91.2
%
Loans delinquent 31-60 days
(3)
..................................
1,953
5.2
Loans delinquent 61-90 days
(3)
..................................
983
2.6
Loans delinquent greater than 90 days
(3)
....................
377
1.0
Total TDR loans in repayment ....................................
37,867
100.0
%
Total TDR loans, gross .................................................
$
59,402
_____
(1) Deferment includes customers who have returned to school or are engaged in other permitted
educational activities and are not yet required to make payments on the loans (e.g., residency
periods for medical students or a grace period for bar exam preparation).
(2) Loans for customers who have requested extension of grace period generally during employment
transition or who have temporarily ceased making full payments due to hardship or other factors,
consistent with established loan program servicing policies and procedures.
(3) The period of delinquency is based on the number of days scheduled payments are contractually past due.
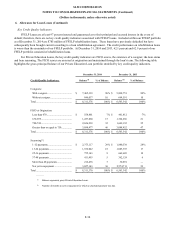
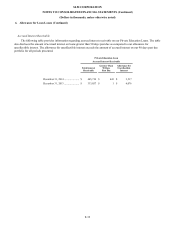
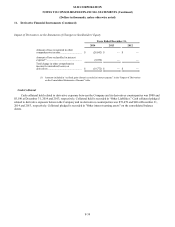
The following table provides the amount of modified loans that resulted in a TDR in the periods presented.
Additionally, the table summarizes charge-offs occurring in the TDR portfolio, as well as TDRs for which a payment default
occurred in the current period within 12 months of the loan first being designated as a TDR. We define payment default as 60
days past due for this disclosure. The majority of our loans that are considered TDRs involve a temporary forbearance of
payments and do not change the contractual interest rate of the loan.
Year Ended December 31, 2014
Modified Loans
Charge-offs
Payment-
Default
TDR Loans .....................
$
59,402
$
948
$
325
F-29