Sallie Mae 2014 Annual Report Download - page 117
Download and view the complete annual report
Please find page 117 of the 2014 Sallie Mae annual report below. You can navigate through the pages in the report by either clicking on the pages listed below, or by using the keyword search tool below to find specific information within the annual report.-
 1
1 -
2
-
3
-
4
-
5
-
6
-
7
-
8
-
9
-
10
-
11
-
12
-
13
-
14
-
15
-
16
-
17
-
18
-
19
-
20
-
21
-
22
-
23
-
24
-
25
-
26
-
27
-
28
-
29
-
30
-
31
-
32
-
33
-
34
-
35
-
36
-
37
-
38
-
39
-
40
-
41
-
42
-
43
-
44
-
45
-
46
-
47
-
48
-
49
-
50
-
51
-
52
-
53
-
54
-
55
-
56
-
57
-
58
-
59
-
60
-
61
-
62
-
63
-
64
-
65
-
66
-
67
-
68
-
69
-
70
-
71
-
72
-
73
-
74
-
75
-
76
-
77
-
78
-
79
-
80
-
81
-
82
-
83
-
84
-
85
-
86
-
87
-
88
-
89
-
90
-
91
-
92
-
93
-
94
-
95
-
96
-
97
-
98
-
99
-
100
-
101
-
102
-
103
-
104
-
105
-
106
-
 107
107 -
 108
108 -
 109
109 -
 110
110 -
 111
111 -
 112
112 -
 113
113 -
 114
114 -
 115
115 -
 116
116 -
 117
117 -
 118
118 -
 119
119 -
 120
120 -
 121
121 -
 122
122 -
 123
123 -
 124
124 -
 125
125 -
 126
126 -
 127
127 -
128
-
129
-
130
-
131
-
132
-
133
-
134
-
135
-
136
-
137
-
138
-
139
-
140
-
141
-
142
-
143
-
144
-
145
-
146
 |
 |

SLM CORPORATION
NOTES TO CONSOLIDATED FINANCIAL STATEMENTS (Continued)
(Dollars in thousands, unless otherwise noted)
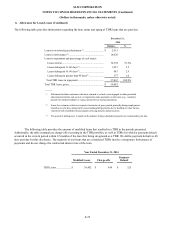
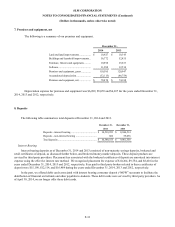
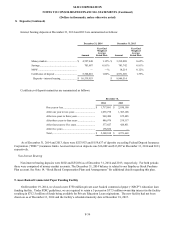
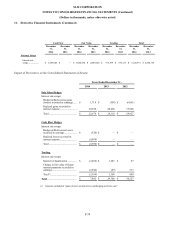
7. Premises and equipment, net
The following is a summary of our premises and equipment.
December 31,
2014
2013
Land and land improvements ................
$
10,927
$
10,345
Buildings and leasehold improvements ..
56,772
52,435
Furniture, fixtures and equipment ..........
10,898
25,633
Software .............................................
31,988
32,534
Premises and equipment, gross .............
110,585
120,947
Accumulated depreciation ....................
(32,115
)
(46,759
)
Premises and equipment, net .................
$
78,470
$
74,188
Depreciation expense for premises and equipment was $6,099, $5,059 and $6,837 for the years ended December 31,
2014, 2013 and 2012, respectively.
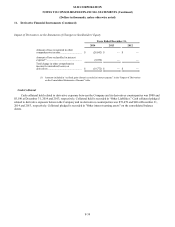
8. Deposits
The following table summarizes total deposits at December 31, 2014 and 2013.
December 31,
December 31,
2014
2013
Deposits - interest bearing ....................................
$
10,539,953
$
8,946,514
Deposits - non-interest bearing .............................
602
55,036
Total deposits ......................................................
$
10,540,555
$
9,001,550
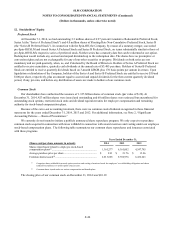
Interest Bearing
Interest bearing deposits as of December 31, 2014 and 2013 consisted of non-maturity savings deposits, brokered and
retail certificates of deposit, as discussed further below, and brokered money market deposits. These deposit products are
serviced by third party providers. Placement fees associated with the brokered certificates of deposit are amortized into interest
expense using the effective interest rate method. We recognized placement fee expense of $10,264, $9,754, and $8,416 in the
years ended December 31, 2014, 2013 and 2012, respectively. Fees paid to third party brokers related to these certificates of
deposit were $15,198, $12,114, and $16,484 during the years ended December 31, 2014, 2013 and 2012, respectively.
In the past, we offered debit cards associated with interest bearing consumer deposit (“NOW”) accounts to facilitate the
distribution of financial aid refunds and other payables to students. These debit cards were serviced by third party providers. As
of April 30, 2014, we no longer offer these debit cards.
F-33