Sallie Mae 2014 Annual Report Download - page 132
Download and view the complete annual report
Please find page 132 of the 2014 Sallie Mae annual report below. You can navigate through the pages in the report by either clicking on the pages listed below, or by using the keyword search tool below to find specific information within the annual report.-
 1
1 -
2
-
3
-
4
-
5
-
6
-
7
-
8
-
9
-
10
-
11
-
12
-
13
-
14
-
15
-
16
-
17
-
18
-
19
-
20
-
21
-
22
-
23
-
24
-
25
-
26
-
27
-
28
-
29
-
30
-
31
-
32
-
33
-
34
-
35
-
36
-
37
-
38
-
39
-
40
-
41
-
42
-
43
-
44
-
45
-
46
-
47
-
48
-
49
-
50
-
51
-
52
-
53
-
54
-
55
-
56
-
57
-
58
-
59
-
60
-
61
-
62
-
63
-
64
-
65
-
66
-
67
-
68
-
69
-
70
-
71
-
72
-
73
-
74
-
75
-
76
-
77
-
78
-
79
-
80
-
81
-
82
-
83
-
84
-
85
-
86
-
87
-
88
-
89
-
90
-
91
-
92
-
93
-
94
-
95
-
96
-
97
-
98
-
99
-
100
-
101
-
102
-
103
-
104
-
105
-
106
-
107
-
108
-
109
-
110
-
111
-
112
-
113
-
114
-
115
-
116
-
117
-
118
-
119
-
120
-
121
-
 122
122 -
 123
123 -
 124
124 -
 125
125 -
 126
126 -
 127
127 -
 128
128 -
 129
129 -
 130
130 -
 131
131 -
 132
132 -
 133
133 -
 134
134 -
 135
135 -
 136
136 -
 137
137 -
 138
138 -
 139
139 -
 140
140 -
 141
141 -
 142
142 -
143
-
144
-
145
-
146
 |
 |

SLM CORPORATION
NOTES TO CONSOLIDATED FINANCIAL STATEMENTS (Continued)
(Dollars in thousands, unless otherwise noted)
15.
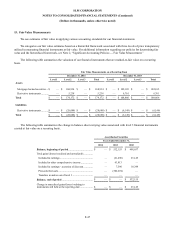
Fair Value Measurements (Continued)
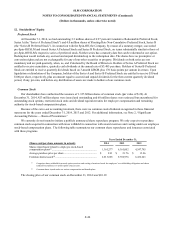
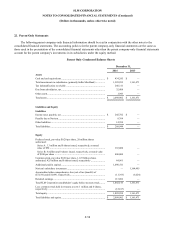
The following table summarizes the fair values of our financial assets and liabilities, including derivative financial
instruments.
December 31, 2014
December 31, 2013
Fair
Valu e
Carrying
Valu e
Difference
Fair
Valu e
Carrying
Valu e
Difference
Earning assets
Loans held for investment, net ..........
$
10,228,399
$
9,509,786
$
718,613
$
8,541,919
$
7,931,377
$
610,542
Cash and cash equivalents ................
2,359,780
2,359,780
—
2,182,865
2,182,865
—
Available for sale investments ...........
168,934
168,934
—
102,105
102,105
—
Accrued interest receivable ...............
469,697
469,697
—
356,283
356,283
—
Tax indemnification receivable .........
240,311
240,311
—
—
—
—
Derivative instruments .....................
5,238
5,238
—
6,761
6,761
—
Total earning assets ..........................
$
13,472,359
$
12,753,746
$
718,613
$
11,189,933
$
10,579,391
$
610,542
Interest-bearing liabilities
Money-market, savings and NOW
accounts .........................................
$
5,231,736
$
5,231,736
$
—
$
4,029,881
$
4,029,881
$
—
Certificates of deposit ......................
5,313,645
5,308,818
(4,827
)
4,984,114
4,971,669
(12,445
)
Accrued interest payable ..................
16,082
16,082
—
13,097
13,097
—
Derivative instruments .....................
28,688
28,688
—
6,149
6,149
—
Total interest-bearing liabilities .........
$
10,590,151
$
10,585,324
(4,827
)
$
9,033,241
$
9,020,796
$
(12,445
)
Excess of net asset fair value over
carrying value
................................
$
713,786
$
598,097
The methods and assumptions used to estimate the fair value of each class of financial instruments are as follows:
Cash and Cash Equivalents
Cash and cash equivalents are carried at cost. Carrying value approximated fair value for disclosure purposes. These are
level 1 valuations.
Investments
Investments are classified as available-for-sale and are carried at fair value in the financial statements. Investments in
mortgage-backed securities are valued using observable market prices of similar assets. As such, these are level 2 valuations.
Loans Held For Investment
Our Private Education Loans and FFELP Loans are accounted for at cost or at the lower of cost or market if the loan is
held-for-sale. For both Private Education Loans and FFELP Loans, fair value was determined by modeling expected loan level
cash flows using stated terms of the assets and internally developed assumptions to determine aggregate portfolio yield, net
present value and average life. The significant assumptions used to determine fair value are prepayment speeds, default rates,
cost of funds and required return on equity. We regularly calibrate these models to take into account relevant transactions in the
marketplace. Significant inputs into the model are not observable. However, we do calibrate the model based on market
transactions when appropriate. As such, these are level 3 valuations.
F-48