Sallie Mae 2014 Annual Report Download - page 46
Download and view the complete annual report
Please find page 46 of the 2014 Sallie Mae annual report below. You can navigate through the pages in the report by either clicking on the pages listed below, or by using the keyword search tool below to find specific information within the annual report.-
 1
1 -
2
-
3
-
4
-
5
-
6
-
7
-
8
-
9
-
10
-
11
-
12
-
13
-
14
-
15
-
16
-
17
-
18
-
19
-
20
-
21
-
22
-
23
-
24
-
25
-
26
-
27
-
28
-
29
-
30
-
31
-
32
-
33
-
34
-
35
-
 36
36 -
 37
37 -
 38
38 -
 39
39 -
 40
40 -
 41
41 -
 42
42 -
 43
43 -
 44
44 -
 45
45 -
 46
46 -
 47
47 -
 48
48 -
 49
49 -
 50
50 -
 51
51 -
 52
52 -
 53
53 -
 54
54 -
 55
55 -
 56
56 -
57
-
58
-
59
-
60
-
61
-
62
-
63
-
64
-
65
-
66
-
67
-
68
-
69
-
70
-
71
-
72
-
73
-
74
-
75
-
76
-
77
-
78
-
79
-
80
-
81
-
82
-
83
-
84
-
85
-
86
-
87
-
88
-
89
-
90
-
91
-
92
-
93
-
94
-
95
-
96
-
97
-
98
-
99
-
100
-
101
-
102
-
103
-
104
-
105
-
106
-
107
-
108
-
109
-
110
-
111
-
112
-
113
-
114
-
115
-
116
-
117
-
118
-
119
-
120
-
121
-
122
-
123
-
124
-
125
-
126
-
127
-
128
-
129
-
130
-
131
-
132
-
133
-
134
-
135
-
136
-
137
-
138
-
139
-
140
-
141
-
142
-
143
-
144
-
145
-
146
 |
 |
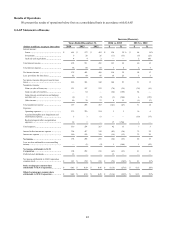
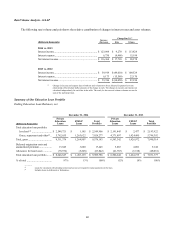
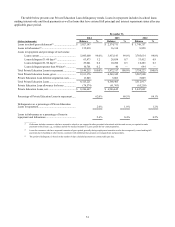
Year Ended December 31, 2013 Compared with Year Ended December 31, 2012
For the year ended December 31, 2013, net income was $259 million, or $.58 diluted earnings per common share,
compared with net income of $218 million, or $.45 diluted earnings per common share for the year ended December 31, 2012.
The increase in net income was primarily due to a $54 million increase in net interest income and a $64 million increase in
gains on sales of securities, offset by a $39 million decrease in net gains on sales of loans.
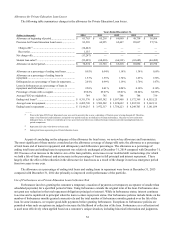
The primary contributors to each of the identified drivers of changes in net income for the 2013 compared with the 2012
are as follows:
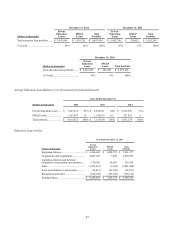
• Net interest income increased by $54 million primarily due to a $0.6 billion increase in average Private Education
Loans outstanding and an increase of $0.6 billion in average FFELP loans outstanding. This was offset by a 48 basis
point decline in the net interest margin. The decline in the net interest margin was primarily a result of an increase the
proportion of lower yielding FFELP loans in our loan portfolio and an increase in the average amount of cash held,
which has a negative effect on our net interest margin.
• Gains on sales of loans, net, decreased $39 million. For the year ended December 31, 2013, we sold $2.4 billion of
loans to an entity that is now a subsidiary of Navient. As a result, we recorded gains of $197 million. In the year ended
December 31, 2012, we recorded $235 million in gains from the sale of $2.6 billion of loans to Navient.
• Gains on sales of securities, net, increased $64 million as a result of a $585 million sale of securities in 2013. There
were no security sales in 2012.
• Operating expenses were $270 million in 2013 compared with $254 million in 2012. Operating expenses increased in
2013 due to increased servicing and marketing costs as well as an $11 million reserve for estimated remediation costs
relating to the 2014 FDIC order. In 2012 we recorded a $9 million write-down of intangible assets.
• The increase in 2013 of the effective tax rate to 38.2 percent from 36.9 percent in the prior year period was primarily
the result of additional state tax expense.
44