Sallie Mae 2014 Annual Report Download - page 35
Download and view the complete annual report
Please find page 35 of the 2014 Sallie Mae annual report below. You can navigate through the pages in the report by either clicking on the pages listed below, or by using the keyword search tool below to find specific information within the annual report.-
 1
1 -
2
-
3
-
4
-
5
-
6
-
7
-
8
-
9
-
10
-
11
-
12
-
13
-
14
-
15
-
16
-
17
-
18
-
19
-
20
-
21
-
22
-
23
-
24
-
 25
25 -
 26
26 -
 27
27 -
 28
28 -
 29
29 -
 30
30 -
 31
31 -
 32
32 -
 33
33 -
 34
34 -
 35
35 -
 36
36 -
 37
37 -
 38
38 -
 39
39 -
 40
40 -
 41
41 -
 42
42 -
 43
43 -
 44
44 -
 45
45 -
46
-
47
-
48
-
49
-
50
-
51
-
52
-
53
-
54
-
55
-
56
-
57
-
58
-
59
-
60
-
61
-
62
-
63
-
64
-
65
-
66
-
67
-
68
-
69
-
70
-
71
-
72
-
73
-
74
-
75
-
76
-
77
-
78
-
79
-
80
-
81
-
82
-
83
-
84
-
85
-
86
-
87
-
88
-
89
-
90
-
91
-
92
-
93
-
94
-
95
-
96
-
97
-
98
-
99
-
100
-
101
-
102
-
103
-
104
-
105
-
106
-
107
-
108
-
109
-
110
-
111
-
112
-
113
-
114
-
115
-
116
-
117
-
118
-
119
-
120
-
121
-
122
-
123
-
124
-
125
-
126
-
127
-
128
-
129
-
130
-
131
-
132
-
133
-
134
-
135
-
136
-
137
-
138
-
139
-
140
-
141
-
142
-
143
-
144
-
145
-
146
 |
 |

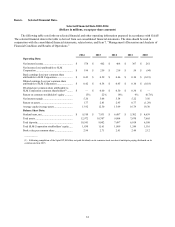
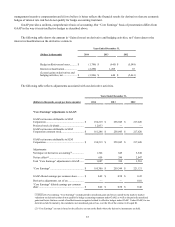
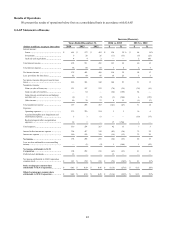
Item 6. Selected Financial Data.
Selected Financial Data 2010-2014
(Dollars in millions, except per share amounts)
The following table sets forth our selected financial and other operating information prepared in accordance with GAAP.
The selected financial data in the table is derived from our consolidated financial statements. The data should be read in
conjunction with the consolidated financial statements, related notes, and Item 7. “Management’s Discussion and Analysis of
Financial Condition and Results of Operations.”
2014
2013
2012
2011
2010
Operating Data:
Net interest income .........................................
$
578
$
462
$
408
$
367
$
261
Net income (loss) attributable to SLM
Corporation ...................................................
$
194
$
259
$
218
$
54
$
(94
)
Basic earnings (loss) per common share
attributable to SLM Corporation ......................
$
0.43
$
0.59
$
0.46
$
0.10
$
(0.19
)
Diluted earnings (loss) per common share
attributable to SLM Corporation ......................
$
0.42
$
0.58
$
0.45
$
0.10
$
(0.18
)
Dividends per common share attributable to
SLM Corporation common shareholders
(1)
........
$
—
$
0.60
$
0.50
$
0.30
$
—
Return on common stockholders’ equity ...........
15
%
22
%
18
%
4
%
(0.7
)%
Net interest margin .........................................
5.26
5.06
5.54
5.22
3.56
Return on assets .............................................
1.77
2.83
2.95
0.77
(1.29
)
Average equity/average assets ..........................
13.92
12.50
15.49
16.79
18.30
Balance Sheet Data:
Student loans, net ...........................................
$
9,510
$
7,931
$
6,487
$
5,302
$
4,659
Total assets ....................................................
12,972
10,707
9,084
7,670
7,665
Total deposits .................................................
10,541
9,002
7,497
6,018
6,108
Total SLM Corporation stockholders’ equity .....
1,830
1,161
1,089
1,244
1,116
Book value per common share .........................
2.99
2.71
2.41
2.44
2.12
_________
(1) Following completion of the Spin-Off, SLM has not paid dividends on its common stock nor does it anticipate paying dividends on its
common stock in 2015.
33