Sallie Mae 2014 Annual Report Download - page 64
Download and view the complete annual report
Please find page 64 of the 2014 Sallie Mae annual report below. You can navigate through the pages in the report by either clicking on the pages listed below, or by using the keyword search tool below to find specific information within the annual report.-
 1
1 -
2
-
3
-
4
-
5
-
6
-
7
-
8
-
9
-
10
-
11
-
12
-
13
-
14
-
15
-
16
-
17
-
18
-
19
-
20
-
21
-
22
-
23
-
24
-
25
-
26
-
27
-
28
-
29
-
30
-
31
-
32
-
33
-
34
-
35
-
36
-
37
-
38
-
39
-
40
-
41
-
42
-
43
-
44
-
45
-
46
-
47
-
48
-
49
-
50
-
51
-
52
-
53
-
 54
54 -
 55
55 -
 56
56 -
 57
57 -
 58
58 -
 59
59 -
 60
60 -
 61
61 -
 62
62 -
 63
63 -
 64
64 -
 65
65 -
 66
66 -
 67
67 -
 68
68 -
 69
69 -
 70
70 -
 71
71 -
 72
72 -
 73
73 -
 74
74 -
75
-
76
-
77
-
78
-
79
-
80
-
81
-
82
-
83
-
84
-
85
-
86
-
87
-
88
-
89
-
90
-
91
-
92
-
93
-
94
-
95
-
96
-
97
-
98
-
99
-
100
-
101
-
102
-
103
-
104
-
105
-
106
-
107
-
108
-
109
-
110
-
111
-
112
-
113
-
114
-
115
-
116
-
117
-
118
-
119
-
120
-
121
-
122
-
123
-
124
-
125
-
126
-
127
-
128
-
129
-
130
-
131
-
132
-
133
-
134
-
135
-
136
-
137
-
138
-
139
-
140
-
141
-
142
-
143
-
144
-
145
-
146
 |
 |
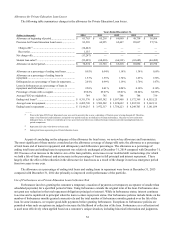
The separate allowance estimates for our TDR and non-TDR portfolios are combined into our total allowance for Private
Education Loan losses. The evaluation of the allowance for loan losses is inherently subjective, as it requires material estimates
and assumptions that may be susceptible to significant changes. If actual future performance in delinquency, charge-offs or
recoveries are significantly different than estimated, this could materially affect our estimate of the allowance for loan losses
and the related provision for loan losses on our income statement.
As part of concluding on the adequacy of the allowance for loan loss, we review key allowance and loan metrics. The
most relevant of these metrics are the allowance coverage of charge-offs ratio; the allowance as a percentage of total loans and
of loans in repayment; and delinquency and forbearance percentages.
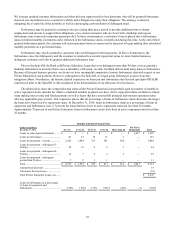
We consider a loan to be delinquent 31 days after the last payment was contractually due. We use a model to estimate the
amount of uncollectible accrued interest on Private Education Loans and reserve for that amount against current period interest
income.
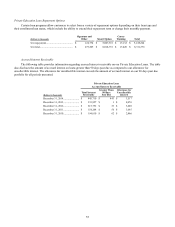
FFELP Loans are insured as to their principal and accrued interest in the event of default subject to a Risk Sharing level
based on the date of loan disbursement. These insurance obligations are supported by contractual rights against the United
States. For loans disbursed after October 1, 1993, and before July 1, 2006, we receive 98 percent reimbursement on all
qualifying default claims. For loans disbursed on or after July 1, 2006, we receive 97 percent reimbursement. For loans
disbursed prior to October 1, 1993, we receive 100 percent reimbursement.
The allowance for FFELP Loan losses uses historical experience of customer default behavior and a two-year loss
confirmation period to estimate the credit losses incurred in the loan portfolio at the reporting date. We apply the default rate
projections, net of applicable Risk Sharing, to each category for the current period to perform our quantitative calculation. Once
the quantitative calculation is performed, we review the adequacy of the allowance for loan losses and determine if qualitative
adjustments need to be considered.
Fair Value Measurement
The most significant assumptions used in fair value measurements, including those related to credit and liquidity risk, are
as follows:
1. Derivatives - When determining the fair value of derivatives, we take into account counterparty credit risk for
positions where we are exposed to the counterparty on a net basis by assessing exposure net of collateral held. The
net exposure for each counterparty is adjusted based on market information available for that specific counterparty,
including spreads from credit default swaps. Additionally, when the counterparty has exposure to us related to our
derivatives, we fully collateralize the exposure, minimizing the adjustment necessary to the derivative valuations
for our own credit risk. A major indicator of market inactivity is the widening of the bid/ask spread in these
markets. In general, the widening of counterparty credit spreads and reduced liquidity for derivative instruments as
indicated by wider bid/ask spreads will reduce the fair value of derivatives.
2. Education Loans - Our Private Education Loans and FFELP Loans are accounted for at cost or at the lower of cost
or fair value if the loan is held-for-sale. The fair values of our student loans are disclosed in Note 15, “Fair Value
Measurements.” For both Private Education Loans and FFELP Loans accounted for at cost, fair value is determined
by modeling loan level cash flows using stated terms of the assets and internally developed assumptions to
determine aggregate portfolio yield, net present value and average life. The significant assumptions used to project
cash flows are prepayment speeds, default rates, cost of funds, the amount funded by deposits versus equity, and
required return on equity. Significant inputs into the models are not generally market-observable. They are either
derived internally through a combination of historical experience and management’s expectation of future
performance (in the case of prepayment speeds, default rates, and capital assumptions) or are obtained through
external broker quotes (as in the case of cost of funds). When possible, market transactions are used to validate the
model and, when appropriate, the model is calibrated to these market transactions.
For further information regarding the effect of our use of fair values on our results of operations, see Note 15, “Fair Value
Measurements.”
62