Rogers 2012 Annual Report Download - page 90
Download and view the complete annual report
Please find page 90 of the 2012 Rogers annual report below. You can navigate through the pages in the report by either clicking on the pages listed below, or by using the keyword search tool below to find specific information within the annual report.-
 1
1 -
2
-
3
-
4
-
5
-
6
-
7
-
8
-
9
-
10
-
11
-
12
-
13
-
14
-
15
-
16
-
17
-
18
-
19
-
20
-
21
-
22
-
23
-
24
-
25
-
26
-
27
-
28
-
29
-
30
-
31
-
32
-
33
-
34
-
35
-
36
-
37
-
38
-
39
-
40
-
41
-
42
-
43
-
44
-
45
-
46
-
47
-
48
-
49
-
50
-
51
-
52
-
53
-
54
-
55
-
56
-
57
-
58
-
59
-
60
-
61
-
62
-
63
-
64
-
65
-
66
-
67
-
68
-
69
-
70
-
71
-
72
-
73
-
74
-
75
-
76
-
77
-
78
-
79
-
 80
80 -
 81
81 -
 82
82 -
 83
83 -
 84
84 -
 85
85 -
 86
86 -
 87
87 -
 88
88 -
 89
89 -
 90
90 -
 91
91 -
 92
92 -
 93
93 -
 94
94 -
 95
95 -
 96
96 -
 97
97 -
 98
98 -
 99
99 -
 100
100 -
101
-
102
-
103
-
104
-
105
-
106
-
107
-
108
-
109
-
110
-
111
-
112
-
113
-
114
-
115
-
116
-
117
-
118
-
119
-
120
-
121
-
122
 |
 |

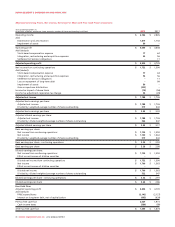
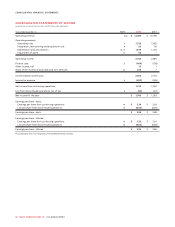
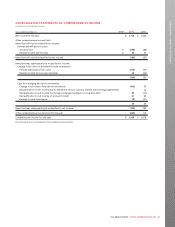
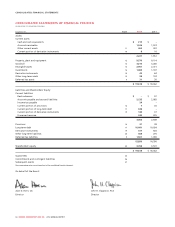
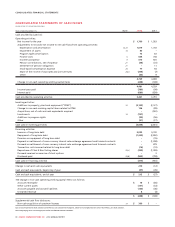
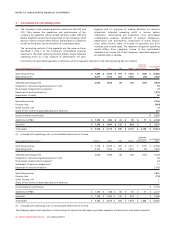
CONSOLIDATED FINANCIAL STATEMENTS
CONSOLIDATED STATEMENTS OF CASH FLOWS
(IN MILLIONS OF CANADIAN DOLLARS)
Years ended December 31, Note 2012 2011
Cash provided by (used in):
Operating activities:
Net income for the year $ 1,700 $ 1,563
Adjustments to reconcile net income to net cash flows from operating activities:
Depreciation and amortization 12,13 1,819 1,743
Impairment of assets 13 80 –
Program rights amortization 73 83
Finance costs 5664 738
Income tax expense 9610 535
Pension contributions, net of expense 21 (36) (41)
Settlement of pension obligations 21 –11
Stock-based compensation expense 23 77 64
Share of the income of associates and joint ventures 24(c) (235) (7)
Other (23) 9
4,729 4,698
Change in non-cash operating working capital items (248) (169)
4,481 4,529
Income taxes paid (380) (99)
Interest paid (680) (639)
Cash provided by operating activities 3,421 3,791
Investing activities:
Additions to property, plant and equipment (“PP&E”) 12 (2,142) (2,127)
Change in non-cash working capital items related to PP&E 136 (89)
Acquisitions, net of cash and cash equivalents acquired –(532)
Investments 14 (707) –
Additions to program rights (90) (56)
Other (31) (27)
Cash used in investing activities (2,834) (2,831)
Financing activities:
Issuance of long-term debt 2,090 4,100
Repayment of long-term debt (1,240) (2,802)
Premium on repayment of long-term debt –(76)
Payment on settlement of cross-currency interest rate exchange agreement and forward contracts –(1,208)
Proceeds on settlement of cross-currency interest rate exchange agreement and forward contracts –878
Transaction costs incurred related to long-term debt (14) (10)
Repurchase of Class B Non-Voting shares 22(c) (350) (1,099)
Proceeds received on exercise of stock options –3
Dividends paid 22(b) (803) (758)
Cash used in financing activities (317) (972)
Change in cash and cash equivalents 270 (12)
Cash and cash equivalents, beginning of year (57) (45)
Cash and cash equivalents, end of year $ 213 $ (57)
The change in non-cash operating working capital items is as follows:
Accounts receivable $15 $ (86)
Other current assets (131) (33)
Accounts payable and accrued liabilities (140) (46)
Unearned revenue 8(4)
$ (248) $ (169)
Supplemental cash flow disclosure:
Non-cash acquisition of spectrum licenses 13 $ 360 $–
Cash and cash equivalents (bank advances) are defined as cash and short-term deposits, which have an original maturity of less than 90 days, less bank advances.
The accompanying notes are an integral part of the consolidated financial statements.
86 ROGERS COMMUNICATIONS INC. 2012 ANNUAL REPORT