Rogers 2012 Annual Report Download - page 29
Download and view the complete annual report
Please find page 29 of the 2012 Rogers annual report below. You can navigate through the pages in the report by either clicking on the pages listed below, or by using the keyword search tool below to find specific information within the annual report.-
 1
1 -
2
-
3
-
4
-
5
-
6
-
7
-
8
-
9
-
10
-
11
-
12
-
13
-
14
-
15
-
16
-
17
-
18
-
 19
19 -
 20
20 -
 21
21 -
 22
22 -
 23
23 -
 24
24 -
 25
25 -
 26
26 -
 27
27 -
 28
28 -
 29
29 -
 30
30 -
 31
31 -
 32
32 -
 33
33 -
 34
34 -
 35
35 -
 36
36 -
 37
37 -
 38
38 -
 39
39 -
40
-
41
-
42
-
43
-
44
-
45
-
46
-
47
-
48
-
49
-
50
-
51
-
52
-
53
-
54
-
55
-
56
-
57
-
58
-
59
-
60
-
61
-
62
-
63
-
64
-
65
-
66
-
67
-
68
-
69
-
70
-
71
-
72
-
73
-
74
-
75
-
76
-
77
-
78
-
79
-
80
-
81
-
82
-
83
-
84
-
85
-
86
-
87
-
88
-
89
-
90
-
91
-
92
-
93
-
94
-
95
-
96
-
97
-
98
-
99
-
100
-
101
-
102
-
103
-
104
-
105
-
106
-
107
-
108
-
109
-
110
-
111
-
112
-
113
-
114
-
115
-
116
-
117
-
118
-
119
-
120
-
121
-
122
 |
 |

MANAGEMENT’S DISCUSSION AND ANALYSIS
• Increased the annualized dividend rate by 11% from $1.42 to $1.58
per Class A Voting and Class B Non-Voting share in February 2012,
paying out $803 million in dividends during 2012. Also, purchased for
cancellation 9.6 million Class B Non-Voting shares for $350 million,
returning $1,153 million to shareholders during the year.
• Issued $1.1 billion of debt securities consisting of $500 million of
3.0% Senior Notes due 2017 and $600 million of 4.0% Senior Notes
due 2022. The net proceeds from the offering were used to repay
amounts outstanding under Rogers’ bank credit facility and for
general corporate purposes, including funding Rogers’ investment
in MLSE.
• Entered into an accounts receivable securitization program on
December 31, 2012, further supplementing our liquidity and
sources of secured funding by up to $900 million and the initial
funding was received on January 14, 2013, subsequent to the 2012
year-end.
• Entered into a new, five-year $2.0 billion syndicated bank credit
facility that will mature in July 2017. It replaces Rogers’ prior bank
credit facility that was scheduled to expire in July 2013. At
December 31, 2012, there were no advances outstanding under the
bank credit facility which, together with our cash and cash
equivalents and the committed funding available under the
accounts receivable securitization program, provided for
$3.1 billion of available liquidity.
• In February 2013, Rogers’ Board of Directors approved an increase
of 10% in the annualized dividend rate from $1.58 to $1.74 per
Class A Voting and Class B Non-Voting share, effective immediately,
to be paid in quarterly amounts of $0.435. In addition, the Board
has approved a renewed share buyback program for the
repurchase of up to $500 million of RCI shares on the open market
over the following twelve months.
• On January 14, 2013, we announced a multipart strategic
transaction with Shaw Communications (“Shaw”) to acquire Shaw’s
cable system in Hamilton, Ontario and secure an option to
purchase Shaw’s Advanced Wireless Service (“AWS”) spectrum
holdings in 2014. We will also sell to Shaw our one-third interest in
specialty channel TVtropolis and enter into negotiations for the
provision of certain services in Western Canada. Rogers’ net cash
investment is expected to total approximately $700 million if all
aspects of the transactions are approved.
• On February 14, 2013, we announced that the Company’s President
and Chief Executive Officer, Nadir Mohamed, has decided to retire
in January 2014. Mr. Mohamed has agreed to work with the Board
of Directors to ensure a seamless and orderly transition and to
continue to lead the company in 2013. The Board of Directors will
appoint a search committee and select a search firm to begin an
international search.
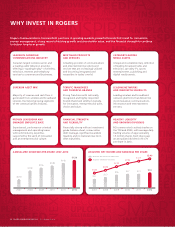
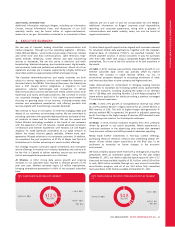
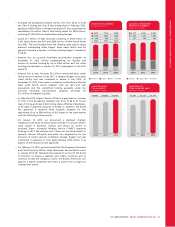
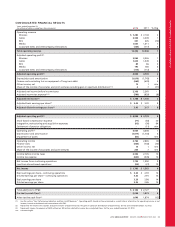
Wireless Cable RBS Media
(In millions of dollars)
REVENUE BY SEGMENT
3,190 3,309 3,358
6,973 7,138 7,280
452 405 351
1,461 1,611 1,620
2010 2011 2012
Wireless Cable & RBS Media
(In millions of dollars)
ADJUSTED OPERATING
PROFIT BY SEGMENT
1,459 1,635 1,694
3,173 3,036 3,063
131 180 190
2010 2011 2012
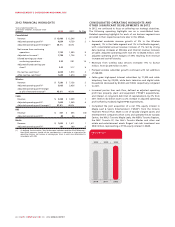
(In millions of dollars)
CONSOLIDATED
TOTAL ASSETS
$17,033 $18,362 $19,618
2010 2011 2012
(In millions of dollars)
ADDITIONS TO
CONSOLIDATED PP&E
$1,821 $2,127 $2,142
2010 2011 2012
2012 ANNUAL REPORT ROGERS COMMUNICATIONS INC. 25