Rogers 2012 Annual Report Download - page 89
Download and view the complete annual report
Please find page 89 of the 2012 Rogers annual report below. You can navigate through the pages in the report by either clicking on the pages listed below, or by using the keyword search tool below to find specific information within the annual report.-
 1
1 -
2
-
3
-
4
-
5
-
6
-
7
-
8
-
9
-
10
-
11
-
12
-
13
-
14
-
15
-
16
-
17
-
18
-
19
-
20
-
21
-
22
-
23
-
24
-
25
-
26
-
27
-
28
-
29
-
30
-
31
-
32
-
33
-
34
-
35
-
36
-
37
-
38
-
39
-
40
-
41
-
42
-
43
-
44
-
45
-
46
-
47
-
48
-
49
-
50
-
51
-
52
-
53
-
54
-
55
-
56
-
57
-
58
-
59
-
60
-
61
-
62
-
63
-
64
-
65
-
66
-
67
-
68
-
69
-
70
-
71
-
72
-
73
-
74
-
75
-
76
-
77
-
78
-
 79
79 -
 80
80 -
 81
81 -
 82
82 -
 83
83 -
 84
84 -
 85
85 -
 86
86 -
 87
87 -
 88
88 -
 89
89 -
 90
90 -
 91
91 -
 92
92 -
 93
93 -
 94
94 -
 95
95 -
 96
96 -
 97
97 -
 98
98 -
 99
99 -
100
-
101
-
102
-
103
-
104
-
105
-
106
-
107
-
108
-
109
-
110
-
111
-
112
-
113
-
114
-
115
-
116
-
117
-
118
-
119
-
120
-
121
-
122
 |
 |

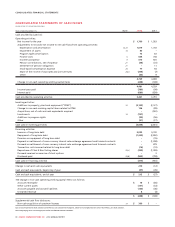
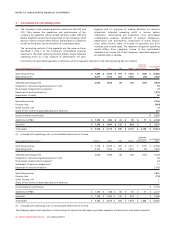
CONSOLIDATED FINANCIAL STATEMENTS
CONSOLIDATED STATEMENTS OF CHANGES IN SHAREHOLDERS’ EQUITY
(IN MILLIONS OF CANADIAN DOLLARS)
Class A
Voting shares Class B
Non-Voting shares
Years ended December 31, 2012 and 2011 Amount
Number of
shares
(000s) Amount
Number of
shares
(000s) Share
premium Retained
earnings
Available-for-sale
financial
assets reserve Hedging
reserve
Total
shareholders’
equity
Balances, January 1, 2012 $ 72 112,462 $ 406 412,395 $ 243 $ 2,443 $ 433 $ (25) $ 3,572
Net income for the year – – – – – 1,700 – – 1,700
Other comprehensive income (loss):
Defined benefit pension plans, net of tax – – – – – (180) – – (180)
Available-for-sale investments, net of tax – – – – – – (190) – (190)
Derivative instruments, net of tax – – – – – – – 35 35
Total other comprehensive loss – – – – – (180) (190) 35 (335)
Comprehensive income for the year – – – – – 1,520 (190) 35 1,365
Transactions with shareholders, recorded
directly in equity:
Repurchase of Class B Non-Voting shares
(note 22(c)) – – (10) (9,637) (243) (97) – – (350)
Dividends declared – – – – – (820) – – (820)
Shares issued on exercise of stock options – – 1 30 – – – – 1
Total transactions with shareholders – – (9) (9,607) (243) (917) – – (1,169)
Balances, December 31, 2012 $ 72 112,462 $ 397 402,788 $ – $ 3,046 $ 243 $ 10 $ 3,768
Class A
Voting shares Class B
Non-Voting shares
Available-for-sale
financial
assets reserve
Amount
Number of
shares
(000s) Amount
Number of
shares
(000s) Share
premium Retained
earnings Hedging
reserve
Total
shareholders’
equity
Balances, January 1, 2011 $ 72 112,462 $ 426 443,072 $ 1,113 $ 1,923 $ 281 $ (55) $ 3,760
Net income for the year – – – – – 1,563 – – 1,563
Other comprehensive income (loss):
Defined benefit pension plans, net of tax – – – – – (67) – – (67)
Available-for-sale investments, net of tax – – – – – – 152 – 152
Derivative instruments, net of tax – – – – – – – 30 30
Total other comprehensive income – – – – – (67) 152 30 115
Comprehensive income for the year – – – – – 1,496 152 30 1,678
Transactions with shareholders, recorded
directly in equity:
Repurchase of Class B Non-Voting shares
(note 22(c)) – – (30) (30,943) (870) (199) – – (1,099)
Dividends declared – – – – – (766) – – (766)
Shares issued on exercise of stock options – – 10 266 – – – – 10
Acquisition of non-controlling interests
(note 7) – – – – – (11) – – (11)
Total transactions with shareholders – – (20) (30,677) (870) (976) – – (1,866)
Balances, December 31, 2011 $ 72 112,462 $ 406 412,395 $ 243 $ 2,443 $ 433 $ (25) $ 3,572
The accompanying notes are an integral part of the consolidated financial statements.
2012 ANNUAL REPORT ROGERS COMMUNICATIONS INC. 85