Rogers 2012 Annual Report Download - page 51
Download and view the complete annual report
Please find page 51 of the 2012 Rogers annual report below. You can navigate through the pages in the report by either clicking on the pages listed below, or by using the keyword search tool below to find specific information within the annual report.-
 1
1 -
2
-
3
-
4
-
5
-
6
-
7
-
8
-
9
-
10
-
11
-
12
-
13
-
14
-
15
-
16
-
17
-
18
-
19
-
20
-
21
-
22
-
23
-
24
-
25
-
26
-
27
-
28
-
29
-
30
-
31
-
32
-
33
-
34
-
35
-
36
-
37
-
38
-
39
-
40
-
 41
41 -
 42
42 -
 43
43 -
 44
44 -
 45
45 -
 46
46 -
 47
47 -
 48
48 -
 49
49 -
 50
50 -
 51
51 -
 52
52 -
 53
53 -
 54
54 -
 55
55 -
 56
56 -
 57
57 -
 58
58 -
 59
59 -
 60
60 -
 61
61 -
62
-
63
-
64
-
65
-
66
-
67
-
68
-
69
-
70
-
71
-
72
-
73
-
74
-
75
-
76
-
77
-
78
-
79
-
80
-
81
-
82
-
83
-
84
-
85
-
86
-
87
-
88
-
89
-
90
-
91
-
92
-
93
-
94
-
95
-
96
-
97
-
98
-
99
-
100
-
101
-
102
-
103
-
104
-
105
-
106
-
107
-
108
-
109
-
110
-
111
-
112
-
113
-
114
-
115
-
116
-
117
-
118
-
119
-
120
-
121
-
122
 |
 |

MANAGEMENT’S DISCUSSION AND ANALYSIS
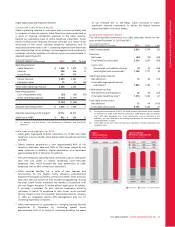
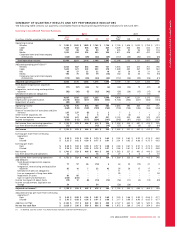
Net Income from Continuing Operations and Adjusted Net Income
The table below reconciles net income from continuing operations to
adjusted net income:
Years ended December 31,
(In millions of dollars, except per share amounts) 2012 2011 % Chg
Net income from continuing
operations $ 1,732 $ 1,590 9
Loss from discontinued operations (32) (27) 19
Net income 1,700 1,563 9
Net income from continuing
operations $ 1,732 $ 1,590 9
Add (deduct):
Stock-based compensation expense 77 64 20
Integration, restructuring and
acquisition expenses 92 56 64
Settlement of pension obligations –11 n/m
Loss on repayment of long-term
debt –99 n/m
Impairment of assets 80 – n/m
Gain on spectrum distribution (233) – n/m
Income tax impact of above items (14) (56) (75)
Income tax adjustment, legislative
tax change 54 (28) n/m
Adjusted net income(1) $ 1,788 $ 1,736 3
Adjusted basic earnings per share(1) $ 3.45 $ 3.20 8
Adjusted diluted earnings per share(1) 3.43 3.17 8
(1) See the section “Key Performance Indicators and Non-GAAP Measures”.
The $142 million year-over-year increase in net income from
continuing operations is due to the growth in adjusted operating
profit of $95 million, the gain on spectrum distribution of $233
million and the decrease in loss on repayment of long-term debt of
$99 million, partially offset by an increase in impairment of assets of
$80 million, depreciation and amortization of $76 million,
restructuring costs of $36 million and an income tax expense of $75
million.
Excluding non-recurring items, last year’s $52 million increase in
adjusted net income is primarily due to the growth in adjusted
operating profit of $95 million and decrease in income tax expense of
$49 million, partially offset by increase in depreciation and
amortization of $76 million.
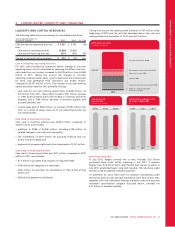
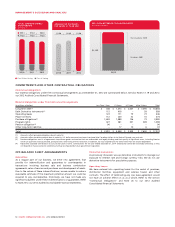
(In millions of dollars)
CONSOLIDATED ADJUSTED
NET INCOME
$1,704 $1,736 $1,788
2010 2011 2012
Discontinued Operations
As discussed in the Cable segment section, the second quarter of 2012
was the last period of operations for our Video business, the
remnants of which are now treated as discontinued operations for
accounting and reporting purposes.
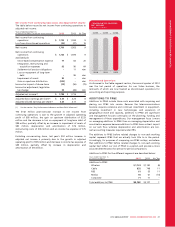
ADDITIONS TO PP&E
Additions to PP&E include those costs associated with acquiring and
placing our PP&E into service. Because the telecommunications
business requires extensive and continual investment in equipment,
including investment in new technologies and expansion of
geographical reach and capacity, additions to PP&E are significant
and management focuses continually on the planning, funding and
management of these expenditures. Our management focus is more
on managing additions to PP&E than on managing depreciation and
amortization expense because additions to PP&E have a direct impact
on our cash flow, whereas depreciation and amortization are non-
cash accounting measures required under IFRS.
The additions to PP&E before related changes to non-cash working
capital represent PP&E that we actually took title to in the period.
Accordingly, for purposes of comparing our PP&E outlays, we believe
that additions to PP&E before related changes to non-cash working
capital best reflect our cost of PP&E in a period, and provide a more
accurate determination for period-to-period comparisons.
Additions to PP&E for the different segments are described below:
Years ended December 31,
(In millions of dollars) 2012 2011 % Chg
Additions to PP&E
Wireless $ 1,123 $1,192 (6)
Cable 832 748 11
RBS 61 55 11
Media 55 61 (10)
Corporate 71 71 –
Total additions to PP&E $2,142 $2,127 1
2012 ANNUAL REPORT ROGERS COMMUNICATIONS INC. 47