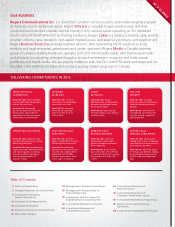
Rogers 2012 Annual Report Download - page 3
Download and view the complete annual report
Please find page 3 of the 2012 Rogers annual report below. You can navigate through the pages in the report by either clicking on the pages listed below, or by using the keyword search tool below to find specific information within the annual report.-
 1
1 -
 2
2 -
 3
3 -
 4
4 -
 5
5 -
 6
6 -
 7
7 -
 8
8 -
 9
9 -
 10
10 -
 11
11 -
 12
12 -
 13
13 -
 14
14 -
15
-
16
-
17
-
18
-
19
-
20
-
21
-
22
-
23
-
24
-
25
-
26
-
27
-
28
-
29
-
30
-
31
-
32
-
33
-
34
-
35
-
36
-
37
-
38
-
39
-
40
-
41
-
42
-
43
-
44
-
45
-
46
-
47
-
48
-
49
-
50
-
51
-
52
-
53
-
54
-
55
-
56
-
57
-
58
-
59
-
60
-
61
-
62
-
63
-
64
-
65
-
66
-
67
-
68
-
69
-
70
-
71
-
72
-
73
-
74
-
75
-
76
-
77
-
78
-
79
-
80
-
81
-
82
-
83
-
84
-
85
-
86
-
87
-
88
-
89
-
90
-
91
-
92
-
93
-
94
-
95
-
96
-
97
-
98
-
99
-
100
-
101
-
102
-
103
-
104
-
105
-
106
-
107
-
108
-
109
-
110
-
111
-
112
-
113
-
114
-
115
-
116
-
117
-
118
-
119
-
120
-
121
-
122
 |
 |
INSPIRE
INSPIRE
INSP
INSPIR
INSPIRE
LIVE
VE
POS
T
ACC
SE
CURE
SECURE
CURE
W
NLOAD
UP
DOWNLOAD
ACCESS
ACCESS
ACCESS
SHARE
ACCESS
CONNECT
WATCH
E
AMING
STRE
AMIN
STREAMI
N
STREAMING
A
ST
RELIABLE
RELIABLE
SURF
SECUR
E
INSPIR
E
RE
LIABLE
RELIABLE
RELIABLE
CONNECT
CONNECT
LIFESTYLE
LIFESTYLE
UPLOAD
NETWORK
CONNEC
T
UPLOAD
CONNFREEDOM
T
UNES
LIFESTYLE
BREATHTAKING
XT
SURF
SURF
NEXT
INSPIR
LI
ACC
LI
UPLOAD
T
INSPIR
LI
ACC
LI
UPLOAD
T
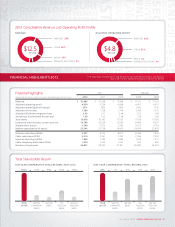
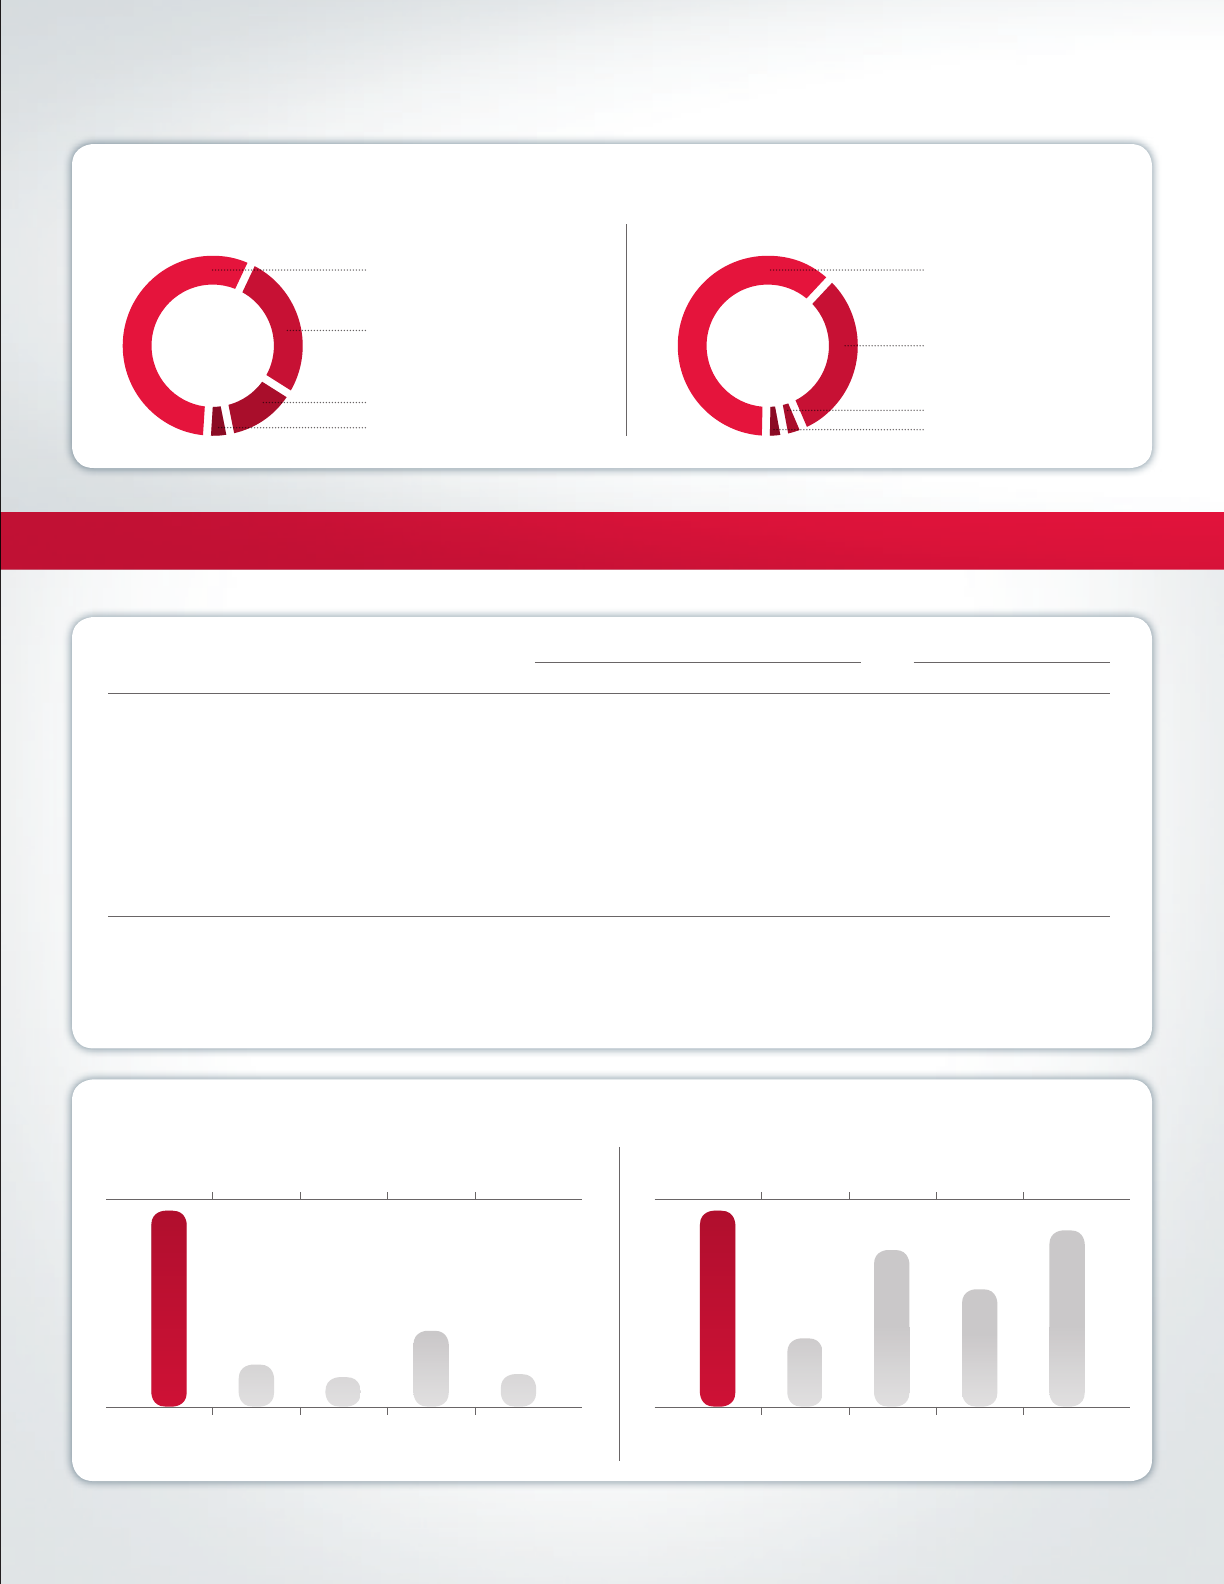
2012 Consolidated Revenue and Operating Profit Profile
REVENUE
$12.5
BILLION
WIRELESS 58%
CABLE 26%
MEDIA 13%
ADJUSTED OPERATING PROFIT
$4.8
BILLION
BUSINESS SOLUTIONS 3%
WIRELESS 62%
CABLE 32%
MEDIA 4%
BUSINESS SOLUTIONS 2%
(IN MILLIONS OF DOLLARS, EXCEPT PER SHARE, SUBSCRIBER AND EMPLOYEE DATA) 2012 2011 2010 2009 2008
Revenue $ 12,486 $ 12,346 $ 11,999 $ 11,537 $ 11,110
Adjusted operating profit 4,834 4,739 4,668 4,407 4,075
Adjusted operating profit margin 39% 38% 39% 38% 37%
Adjusted net income 1,788 1,736 1,704 1,569 1,272
Adjusted diluted earnings per share 3.43 3.17 2.94 2.53 1.99
Annualized dividend rate at year-end 1.58 1.42 1.28 1.16 1.00
Total assets 19,618 18,362 17,033 17,018 17,0 82
Long-term debt (includes current portion) 10,789 10,034 8,654 8,464 8,507
Shareholders’ equity 3,768 3,572 3,760 4,273 4,716
Market capitalization of equity 23,346 20,736 19,435 19,476 23,679
Wireless subscribers (000s) 9,437 9,335 8,977 8,494 7,942
Cable subscribers (000s) 2,214 2,297 2,305 2,296 2,320
Internet subscribers (000s) 1,864 1,793 1,686 1,619 1,571
Cable telephony subscribers (000s) 1,074 1,052 1,003 937 840
Number of employees 26,801 28,745 27,971 28,985 29,200
Financial Highlights
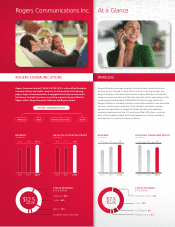
Total Shareholder Return
TEN-YEAR COMPARATIVE TOTAL RETURN: 2003–2012 ONE-YEAR COMPARATIVE TOTAL RETURN: 2012
RCI.B
on TSX
RCI.B
on TSX
654%
S&P/TSX
COMPOSITE
INDEX
S&P/TSX
COMPOSITE
INDEX
141%
S&P 500
INDEX
S&P 500
INDEX
TSX
TELECOM
INDEX
TSX
TELECOM
INDEX
S&P 500
TELECOM
INDEX
S&P 500
TELECOM
INDEX
99% 254% 109% 20% 7% 16% 12% 18%
IFRS CDN GAAP
FINANCIAL HIGHLIGHTS 2012 FOR A DETAILED DISCUSSION OF OUR FINANCIAL AND OPERATING METRICS AND RESULTS,
PLEASE SEE THE ACCOMPANYING MD&A LATER IN THIS REPORT.
2012 ANNUAL REPORT ROGERS COMMUNICATIONS INC. 01