Rogers 2012 Annual Report Download - page 54
Download and view the complete annual report
Please find page 54 of the 2012 Rogers annual report below. You can navigate through the pages in the report by either clicking on the pages listed below, or by using the keyword search tool below to find specific information within the annual report.-
 1
1 -
2
-
3
-
4
-
5
-
6
-
7
-
8
-
9
-
10
-
11
-
12
-
13
-
14
-
15
-
16
-
17
-
18
-
19
-
20
-
21
-
22
-
23
-
24
-
25
-
26
-
27
-
28
-
29
-
30
-
31
-
32
-
33
-
34
-
35
-
36
-
37
-
38
-
39
-
40
-
41
-
42
-
43
-
 44
44 -
 45
45 -
 46
46 -
 47
47 -
 48
48 -
 49
49 -
 50
50 -
 51
51 -
 52
52 -
 53
53 -
 54
54 -
 55
55 -
 56
56 -
 57
57 -
 58
58 -
 59
59 -
 60
60 -
 61
61 -
 62
62 -
 63
63 -
 64
64 -
65
-
66
-
67
-
68
-
69
-
70
-
71
-
72
-
73
-
74
-
75
-
76
-
77
-
78
-
79
-
80
-
81
-
82
-
83
-
84
-
85
-
86
-
87
-
88
-
89
-
90
-
91
-
92
-
93
-
94
-
95
-
96
-
97
-
98
-
99
-
100
-
101
-
102
-
103
-
104
-
105
-
106
-
107
-
108
-
109
-
110
-
111
-
112
-
113
-
114
-
115
-
116
-
117
-
118
-
119
-
120
-
121
-
122
 |
 |
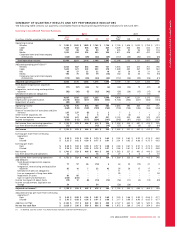
MANAGEMENT’S DISCUSSION AND ANALYSIS
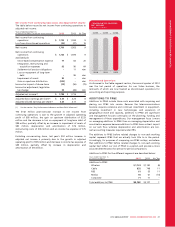
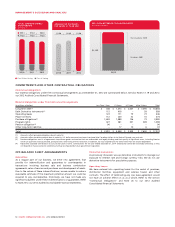
Summary of Fourth Quarter 2012 Results
In the fourth quarter of 2012, consolidated operating revenue
increased by 3% to $3,261 million, compared to $3,155 million in the
same period in 2011. We experienced revenue growth of 5% in
Wireless, 2% in Cable and 1% in Media, partially offset by the 5%
decline in RBS revenue. Consolidated fourth quarter adjusted
operating profit increased 7% year-over-year to $1,176 million, with
3% growth at Wireless, 4% growth at Cable, 70% growth at Media
and 35% growth at RBS. The fourth quarter results generally reflect
improvements made over the year to enhance our cost structure and
to reaccelerate the rate of revenue growth. The results also reflect a
temporary net benefit at Media due to the recently resolved NHL
player lockout, which contributed to reductions in sports
broadcasting costs as no NHL games were produced or aired in the
fourth quarter.
During the fourth quarter of 2012, we recorded net income from
continuing operations of $529 million, with basic and diluted
earnings per share from continuing operations of $1.03 and $1.02,
respectively, compared to a net income from continuing operations of
$335 million, with basic and diluted earnings per share from
continuing operations of $0.63, respectively, in the corresponding
period of 2011.
Impact of Trends on Quarterly Results
In addition to the seasonal trends described above, revenue and
operating profit across all of our businesses can fluctuate from
changes in general economic conditions.
The quarterly trends in Wireless revenue and operating profit reflect
the growing number of wireless voice and data subscribers, increased
handset subsidies driven by the consumer shift towards smartphones,
and a modest decrease in blended ARPU reflective of ongoing
changes in wireless voice pricing. Wireless has continued its strategy
of targeting higher value postpaid subscribers, which has also
contributed to the significantly heavier mix of postpaid versus
prepaid subscribers. Growth in both our customer base and overall
market penetration have been accompanied by coincident increases
over time in customer service, retention, credit and collection costs.
However, much of these cost increases have been offset by operating
efficiency gains.
The quarterly trends in Cable services revenue and operating profit
increases are primarily due to greater penetration and usage of its
Internet, digital and telephony products and services, combined with
pricing changes made over the past year.
The quarterly trends in RBS operating profit margin primarily reflect
the ongoing shift from lower-margin off-net legacy long distance and
data services to higher-margin on-net next generation IP-based
services.
The quarterly trends in Media’s results are generally attributable to
continual investment in prime-time programming, increased
subscriber fees and fluctuations in advertising and consumer market
conditions.
Impact of Seasonality on Quarterly Results
Our operating results are subject to seasonal fluctuations that
materially impact quarter-to-quarter operating results. As a result,
one quarter’s operating results are not necessarily indicative of what
a subsequent quarter’s operating results will be. Wireless, Cable and
Media each have unique seasonal aspects to their businesses:
• Wireless’ operating results are influenced by the timing of our
marketing/promotional expenditures and higher levels of
subscriber additions and subsidies, resulting in higher subscriber
acquisition and activation-related expenses in certain periods. Such
heightened activity generally occurs during the third and fourth
quarters, and can also occur or be accentuated by the launch of
popular new wireless handset models.
• Cable’s operating results are subject to modest seasonal
fluctuations in subscriber additions and disconnections. Typically,
this is caused by movements of university and college students and
individuals temporarily suspending service for extended vacations
or seasonal relocations, as well as our concentrated marketing
efforts generally conducted during the fourth quarter.
• The seasonality at Media is a result of fluctuations in advertising
and related retail cycles related to periods of increased consumer
activity and to the Major League Baseball season, where revenues
and expenses are concentrated in the spring, summer and fall
months.
RBS does not generally have any unique seasonal aspects to its
business.
Other fluctuations in net income from quarter-to-quarter can also be
attributed to losses on the repayment of debt, foreign exchange gains
or losses, changes in the fair value of derivative instruments, other
income and expenses, impairment of assets and changes in income tax
expense, as described above.
50 ROGERS COMMUNICATIONS INC. 2012 ANNUAL REPORT