Rogers 2012 Annual Report Download - page 110
Download and view the complete annual report
Please find page 110 of the 2012 Rogers annual report below. You can navigate through the pages in the report by either clicking on the pages listed below, or by using the keyword search tool below to find specific information within the annual report.-
 1
1 -
2
-
3
-
4
-
5
-
6
-
7
-
8
-
9
-
10
-
11
-
12
-
13
-
14
-
15
-
16
-
17
-
18
-
19
-
20
-
21
-
22
-
23
-
24
-
25
-
26
-
27
-
28
-
29
-
30
-
31
-
32
-
33
-
34
-
35
-
36
-
37
-
38
-
39
-
40
-
41
-
42
-
43
-
44
-
45
-
46
-
47
-
48
-
49
-
50
-
51
-
52
-
53
-
54
-
55
-
56
-
57
-
58
-
59
-
60
-
61
-
62
-
63
-
64
-
65
-
66
-
67
-
68
-
69
-
70
-
71
-
72
-
73
-
74
-
75
-
76
-
77
-
78
-
79
-
80
-
81
-
82
-
83
-
84
-
85
-
86
-
87
-
88
-
89
-
90
-
91
-
92
-
93
-
94
-
95
-
96
-
97
-
98
-
99
-
 100
100 -
 101
101 -
 102
102 -
 103
103 -
 104
104 -
 105
105 -
 106
106 -
 107
107 -
 108
108 -
 109
109 -
 110
110 -
 111
111 -
 112
112 -
 113
113 -
 114
114 -
 115
115 -
 116
116 -
 117
117 -
 118
118 -
 119
119 -
 120
120 -
121
-
122
 |
 |

NOTES TO CONSOLIDATED FINANCIAL STATEMENTS
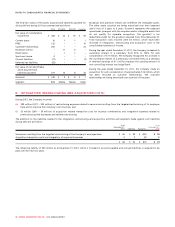
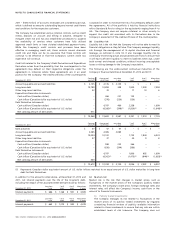
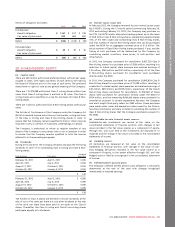
At December 31, 2011, 91.7% of the Company’s U.S. dollar-
denominated long-term debt instruments were hedged against
fluctuations in foreign exchange rates for accounting purposes. At
December 31, 2011, details of the Derivatives net liability position are
as follows:
December 31, 2011 U.S. $
notional Exchange
rate Cdn. $
notional Fair
value
Debt Derivatives accounted
for as cash flow hedges:
As assets $ 1,975 1.0252 $ 2,025 $ 39
As liabilities 1,905 1.2668 2,413 (540)
Debt Derivatives not
accounted for as hedges:
As assets 350 1.0258 359 2
Net mark-to-market liability
Debt Derivatives (499)
Expenditure Derivatives
accounted for as cash flow
hedges:
As assets 620 0.9643 598 39
Net mark-to-market liability $ (460)
(e) Fair values:
The carrying value of accounts receivable, bank advances and
accounts payable and accrued liabilities approximate their fair values
because of the short-term nature of these financial instruments.
The fair value of the Company’s publicly traded investments is
determined by quoted market values for each of the investments. The
fair value of the Company’s private investments are determined by
management using well established market, asset based or projected
income valuation techniques that are applied appropriately to each
investment depending on its future operating and profitability
prospects.
The carrying value of the bank credit facility approximates its fair
value because the interest rates approximate current market rates.
The fair values of each of the Company’s public debt instruments are
based on the year-end trading values. The fair values of the
Company’s Derivatives are determined using an estimated credit-
adjusted mark-to-market valuation. In the case of Derivatives in an
asset position, the credit spread for the financial institution
counterparty is added to the risk-free discount rate to determine the
estimated credit-adjusted value for each derivative. In the case of
Derivatives in a liability position, the Company’s credit spread is
added to the risk-free discount rate for each derivative.
The change in fair value of Derivatives not designated as hedges for
accounting purposes are recorded immediately in the consolidated
statements of income.
Fair value estimates are made at a specific point in time based on
relevant market information and information about the financial
instruments. The estimates are subjective in nature and involve
uncertainties and matters of judgment.
The Company provides disclosure of the three-level hierarchy that
reflects the significance of the inputs used in making the fair value
measurements. Fair value of financial assets and financial liabilities
included in Level 1 are determined by reference to quoted prices in
active markets for identical assets and liabilities. Financial assets and
financial liabilities in Level 2 include valuations using inputs based on
observable market data, either directly or indirectly, other than the
quoted prices. Level 3 valuations are based on inputs that are not
based on observable market data. There were no material financial
instruments categorized in Level 3 (valuation technique using non-
observable market inputs) as at December 31, 2012 and 2011.
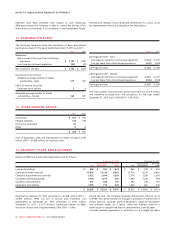
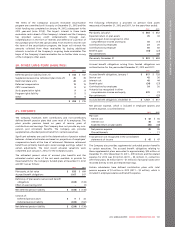
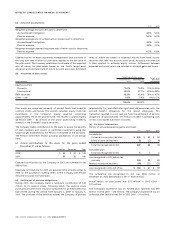
Financial instruments carried at fair value by valuation method are as
follows:
Fair value measurements at reporting date
Carrying value Level 1(1) Level 2(2)
Dec. 31, Dec. 31, Dec. 31,
2012 2011 2012 2011 2012 2011
Financial assets
Available-for-sale, measured at fair value:
Investments in publicly traded companies $ 624 $ 850 $ 624 $ 850 $–$–
Held-for-trading:
Debt Derivatives not accounted for as hedges 32––32
Expenditure Derivatives accounted for as cash flow hedges 13 39 ––13 39
$ 640 $ 891 $ 624 $ 850 $16$41
Financial liabilities
Held-for-trading:
Debt Derivatives accounted for as cash flow hedges $ 527 $ 501 $–$–$ 527 $ 501
(1) Level 1 classification comprises of financial assets and financial liabilities that are carried at fair value determined by quoted market prices.
(2) Level 2 classification comprises of financial assets and financial liabilities that are carried at fair value determined by valuation technique
using observable market inputs.
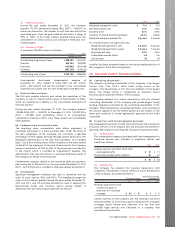
The Company’s long-term debt is initially measured at fair value and
then subsequently measured at amortized cost using the effective
interest method, as follows:
2012 2011
Carrying
amount Fair
value Carrying
amount Fair
value
Long-term debt $ 10,441 $ 12,603 $ 10,034 $ 11,471
The Company did not have any non-derivative held-to-maturity
financial assets during the years ended December 31, 2012 and 2011.
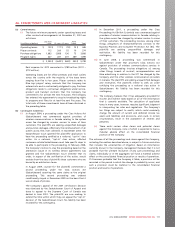
(f) Accounts receivable securitization:
On December 31, 2012 the Company entered into an accounts
receivable securitization program with a Canadian financial
institution which will enable it to sell certain trade receivables into
the program with the proceeds recorded in current liabilities as
revolving floating rate loans of up to $900 million, secured by those
trade receivables. The Company will continue to service these
accounts receivable and they will continue to be recorded in current
assets on the consolidated statement of financial position.
106 ROGERS COMMUNICATIONS INC. 2012 ANNUAL REPORT