Rogers 2012 Annual Report Download - page 114
Download and view the complete annual report
Please find page 114 of the 2012 Rogers annual report below. You can navigate through the pages in the report by either clicking on the pages listed below, or by using the keyword search tool below to find specific information within the annual report.-
 1
1 -
2
-
3
-
4
-
5
-
6
-
7
-
8
-
9
-
10
-
11
-
12
-
13
-
14
-
15
-
16
-
17
-
18
-
19
-
20
-
21
-
22
-
23
-
24
-
25
-
26
-
27
-
28
-
29
-
30
-
31
-
32
-
33
-
34
-
35
-
36
-
37
-
38
-
39
-
40
-
41
-
42
-
43
-
44
-
45
-
46
-
47
-
48
-
49
-
50
-
51
-
52
-
53
-
54
-
55
-
56
-
57
-
58
-
59
-
60
-
61
-
62
-
63
-
64
-
65
-
66
-
67
-
68
-
69
-
70
-
71
-
72
-
73
-
74
-
75
-
76
-
77
-
78
-
79
-
80
-
81
-
82
-
83
-
84
-
85
-
86
-
87
-
88
-
89
-
90
-
91
-
92
-
93
-
94
-
95
-
96
-
97
-
98
-
99
-
100
-
101
-
102
-
103
-
 104
104 -
 105
105 -
 106
106 -
 107
107 -
 108
108 -
 109
109 -
 110
110 -
 111
111 -
 112
112 -
 113
113 -
 114
114 -
 115
115 -
 116
116 -
 117
117 -
 118
118 -
 119
119 -
 120
120 -
 121
121 -
 122
122
 |
 |

NOTES TO CONSOLIDATED FINANCIAL STATEMENTS
23. STOCK OPTIONS, SHARE UNITS AND SHARE
PURCHASE PLANS:
Stock-based compensation to employees is measured at fair value.
Fair value is determined using the Company’s Class B Non-Voting
share price, and the Black-Scholes option pricing model (“Black-
Scholes model”) or trinomial option pricing models, depending on
the nature of the share-based award.
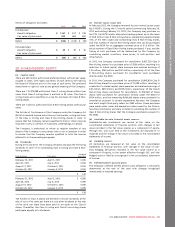
A summary of stock-based compensation expense, which is included
in employee salaries and benefits expense, is as follows:
2012 2011
Stock-based compensation:
Stock options (a) $35 $29
Restricted share units (b) 35 26
Deferred share units (c) 79
$77 $64
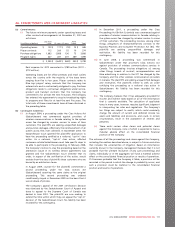
At December 31, 2012, the Company had a liability of $195 million
(December 31, 2011 – $194 million), of which $158 million (December
31, 2011 – $161 million) is a current liability related to stock-based
compensation recorded at its fair value, including stock options, RSUs
and DSUs. The total intrinsic value of vested liabilities, which is the
difference between the strike price of the share-based awards and
the trading price of the RCI Class B Non-Voting shares for all vested
share-based awards at December 31, 2012 was $109 million
(December 31, 2011 – $124 million).
(a) Stock options:
(i) Stock option plans:
Options to purchase Class B Non-Voting shares of the Company
on a one-for-one basis may be granted to employees, directors
and officers of the Company by the Board of Directors or by the
Company’s Management Compensation Committee. There are
65 million options authorized under various plans. The term of
each option is seven to ten years and the vesting period is
generally graded vesting over four years but may be adjusted by
the Management Compensation Committee on the date of
grant. The exercise price for options is equal to the fair market
value of the Class B Non-Voting shares determined as the five-
day average before the grant date as quoted on the TSX.
(ii) Performance options:
During the year ended December 31, 2012, the Company granted
806,100 performance-based options (2011 – 581,300) to certain key
executives. These options vest on a graded basis over four years
provided that certain targeted stock prices are met on or after each
anniversary date. At December 31, 2012, 5,435,555 performance
options (December 31, 2011 – 5,056,430) were outstanding.
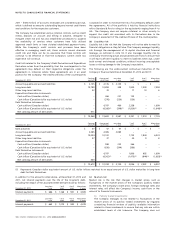
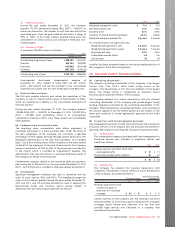
(iii) Summary of stock options:
A summary of the stock option plans, which includes performance options, is as follows:
2012 2011
Number of
options
Weighted
average
exercise price Number of
options
Weighted
average
exercise price
Outstanding, beginning of year 10,689,099 $ 28.59 11,841,680 $ 26.42
Granted 1,397,751 37.86 1,133,600 34.35
Exercised (3,075,879) 21.53 (1,778,783) 15.96
Forfeited (276,943) 35.53 (507,398) 35.20
Outstanding, end of year 8,734,028 $ 32.34 10,689,099 $ 28.59
Exercisable, end of year 4,638,496 $ 28.94 5,716,945 $ 22.81
At December 31, 2012, the range of exercise prices, the weighted average exercise price and the weighted average remaining contractual
life are as follows:
Options outstanding Options exercisable
Range of exercise prices Number
outstanding
Weighted average
remaining contractual
life (years) Weighted average
exercise price Number
exercisable Weighted average
exercise price
$ 4.83 – $ 9.99 240,735 0.53 $ 7.52 240,735 $ 7.52
$ 10.00 – $ 18.99 558,532 1.06 11.22 558,532 11.22
$ 19.00 – $ 24.99 758,158 0.16 22.61 758,158 22.61
$ 25.00 – $ 29.99 1,132,836 3.06 29.40 710,467 29.40
$ 30.00 – $ 37.99 3,443,864 5.09 35.52 805,081 33.68
$ 38.00 – $ 46.94 2,599,903 1.54 39.07 1,565,523 38.98
8,734,028 2.96 $ 32.34 4,638,496 $ 28.94
Unrecognized stock-based compensation expense at
December 31, 2012 related to stock-option plans was $11 million
(2011 – $9 million), and will be recorded in the consolidated
statements of income over the next four years as the options
vest.
(b) Restricted share units:
(i) RSU plan:
The RSU plan enables employees, officers and directors of the
Company to participate in the growth and development of the
Company. Under the terms of the plan, RSUs are issued to the
participant and the units issued will cliff vest over a period not
to exceed three years from the grant date.
On the vesting date, the Company shall redeem all of the
participants’ RSUs in cash or by issuing one Class B Non-Voting
share for each RSU. The Company has reserved 4,000,000 Class B
Non-Voting shares for issuance under this plan. During the year
ended December 31, 2012, the Company granted 721,005 RSUs
(2011 – 738,973).
110 ROGERS COMMUNICATIONS INC. 2012 ANNUAL REPORT